
What-if analysis is the process of changing input values to see how the changes affect other output data. What-if analysis is a powerful tool in Excel.
Contents
What-if analysis
Breakeven analysis is a type of what-if analysis that determines the point where revenues equal expenses or the point of zero profit. This breakeven analysis examines fixed costs and variable costs.
Sensitivity analysis is another type of what-if analysis that attempts to determine how sensitive the results of an analysis are to changes in the inputs and assumptions.
What-if analysis Excel menu
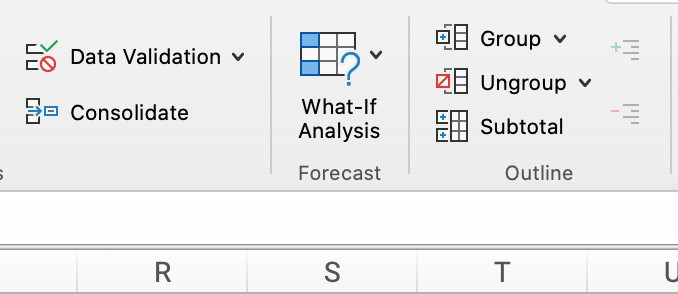
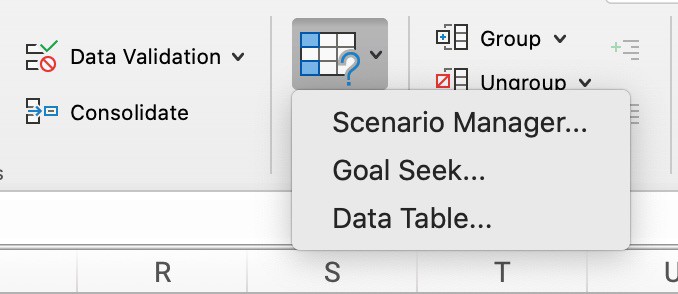
The What If analysis menu is on the Data ribbon. The three options under the button are:
- Scenario Manager
- Goal Seek
- Data Tables
Scenario Manager
Scenario Manager allows substituting input values for multiple cells (up to 32). So, you can view the results of different input values (scenarios) at the same time. This could be a “best case” or “worst case” scenario.
Goal Seek
Goal Seek allows changing the value in one cell to achieve a target in another cell. This is a simpler alternative to Solver. Solver can change multiple cells and includes constraints.
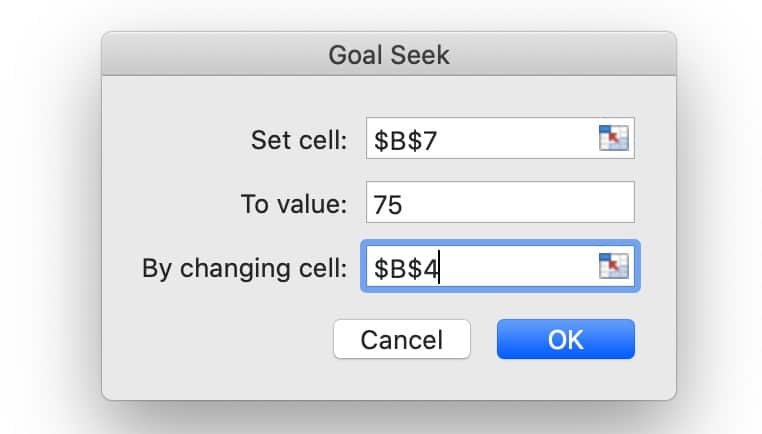
Goal Seek has three arguments:
- Target cell: the cell that you want to change to a target number; called “Set cell”
- Target Value: the value you want the set cell to be; called “To cell”
- Input cell: the input cell to change the target cell; called “By changing cell”
Goal seek can only change one cell to a given value. The target cell must contain a formula so that a change in the changing cell will cause it to be the target value. Goal seek menu looks like this:
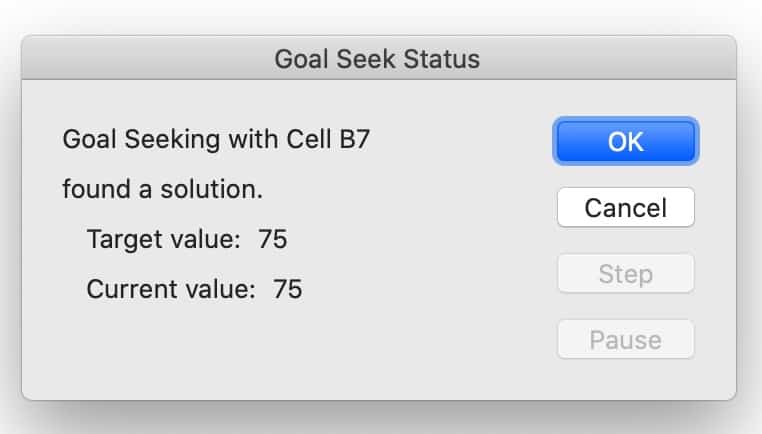
When the goal seek is successful, the menu changes to Goal Seek Status:
Data Tables
A data table gives many results based on changing one or two variables. Data tables have input cells and result cells. Input cells have the values that may change and the result cells have use formulas to calculate the results.
- One-Variable Data Table: showing a what-if scenario if only one variable is changed, like the number of units sold
- Two-Variable Data Table: showing a what-if scenario if two variables are changed, like the number of units sold and the sales price
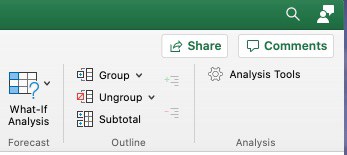
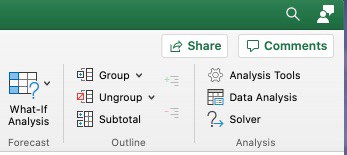
Analysis Tools – Excel Add-ins
There are two buttons that can be added to the Data tab by using the Add-ins option. These buttons are Data Analysis and Solver.
Note: these buttons are included in Excel, but they are not turned on by default. You will have to add Data Analysis and Solver manually. Then the buttons are turned on in the future.
Solver
Solver allows changing several cells to reach a goal in a related cell called the objective cell. The changing values are called the variable cells or the decision variables. The result is called the solver model.
- Objective cell: – the single cell that is the goal of the Solver analysis. This cell can be minimized, maximized, or set to a specific value.
- Variable cells: the cells that can be changed for the Solver analysis. These are also known as decision variables.
- Constraints: the restrictions on the values in the changing decision variables.
- Solver Model: combination of the objective cell results based on the decision variables subject to constraints
The solver can use solving methods that are linear or non-linear.
Data tables explained tutorial
Goal seek function tutorial
Excel Basics Lessons for Beginners
Here are the Excel basics lessons for beginners in The Ultimate Guide to Finally Learn Excel.
- Introduction to Excel
- Statistical Analysis in Excel
- Creating Graphs in Excel
- Logical Functions in Excel
- Text Functions in Excel
- Financial Functions in Excel
- Lookup Functions in Excel
- Data Analysis in Excel
- What-if Analysis in Excel
See Also: