Using Excel is a great way to start data analysis. Excel can handle large data sets with tools like pivot tables, pivot charts, and regression analysis.
Contents
Excel Add-ins – Data Analysis
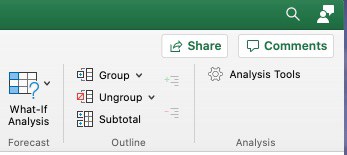
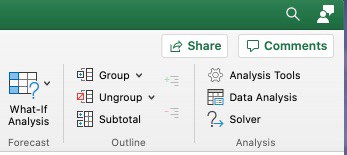
There are two buttons that can be added to the Data tab by using the Add-ins option. These buttons are Data Analysis and Solver.
Note: These buttons are included in Excel, but they are not turned on by default. You will have to add Data Analysis and Solver manually. Then the buttons are turned on in the future.


Data Analysis
The Data Analysis tool includes statistical tools such as ANOVA, regression, t-test, and z-test.
Excel has a tool called Analyze Data that can suggest data analysis based on a dataset.
Regression
The regression function is located in the Data Analysis tool on the Data ribbon. The regression formula is y = a + bx.
- y is the dependent variable
- x is the independent variable
- a is the y-intercept
- b is the slope of the line
One use of regression is to estimate fixed and variable costs. In this case, fixed costs would be A, variable costs per unit would be B, and the number of units would be X.
Statistical Tools
Data analysis includes statistical tools such as ANOVA, regression, t-test, and z-test.
Pivot Tables and Pivot Charts
Pivot Table
A pivot table can summarize many data points into a single, dynamic table. It can summarize by totals, by products, dates, names, etc. It can be changed with the use of slicers.
Pivot Chart
A dynamic chart based on a pivot table. It can be changed dynamically with the use of slicers.
Slicers
Slicers are used for pivot tables and pivot charts in Excel. They can dynamically change the data shown by the pivot table. This can be used for a dynamic dashboard.
Excel Tips
Template
Workbook that is organized in a logical and consistent way to help users understand the assumptions and the calculated results. There should be an input section and a section for comments, documentation, and notes.
All formulas should be built on assumptions with proper formulas.
Data Validation
Located in the Data tab
Data Validation can minimize errors in data entry into worksheets. This defines what is a valid entry into the cell. It can be a list or a range of acceptable values. If there is an error, it can display an error message.
Protection
Located in the Tools menu
- Worksheet protection – protect the contents of the worksheet to prevent changing, moving, or deleting the data. Cells can be unlocked to allow for data entry.
- Workbook protection – protect a workbook to prevent inserting, deleting, or renaming a worksheet.
- File protection – protect an entire workbook file for optimal security.
Formula Auditing
Located in the Formula menu
- Trace precedents – show arrows to indicate which cells affect the value of the current cell
- Trace dependents – show arrows to indicate which cells are affected by the current cell
- Show formulas – toggles the display of formulas or the results of the formulas
- Error checking – error checking tool and trace errors
- Evaluate formulas – displays the different parts of a nested formula in the order of calculation
- Print ⌘P or Ctrl P
- Print to fit – minimize spreadsheet to set number of pages
- Print active sheets – only the selected sheet
- Print workbook – prints the entire workbook
Use the print function to preview how it will look after printing or as a PDF file.
Excel Video: Pivot Tables and Pivot Charts Explained
Excel Basics Lessons for Beginners
Here are the Excel basics lessons for beginners in The Ultimate Guide to Finally Learn Excel.
- Introduction to Excel
- Statistical Analysis in Excel
- Creating Graphs in Excel
- Logical Functions in Excel
- Text Functions in Excel
- Financial Functions in Excel
- Lookup Functions in Excel
- Data Analysis in Excel
- What-if Analysis in Excel
See Also:

Jeff Mankin teaches financial literacy and Excel. He is the founder of Finally Learn.


