
There are eleven logical functions in Excel. They include IF, AND, OR, TRUE, FALSE, and NOT functions. These help analysts make decisions.
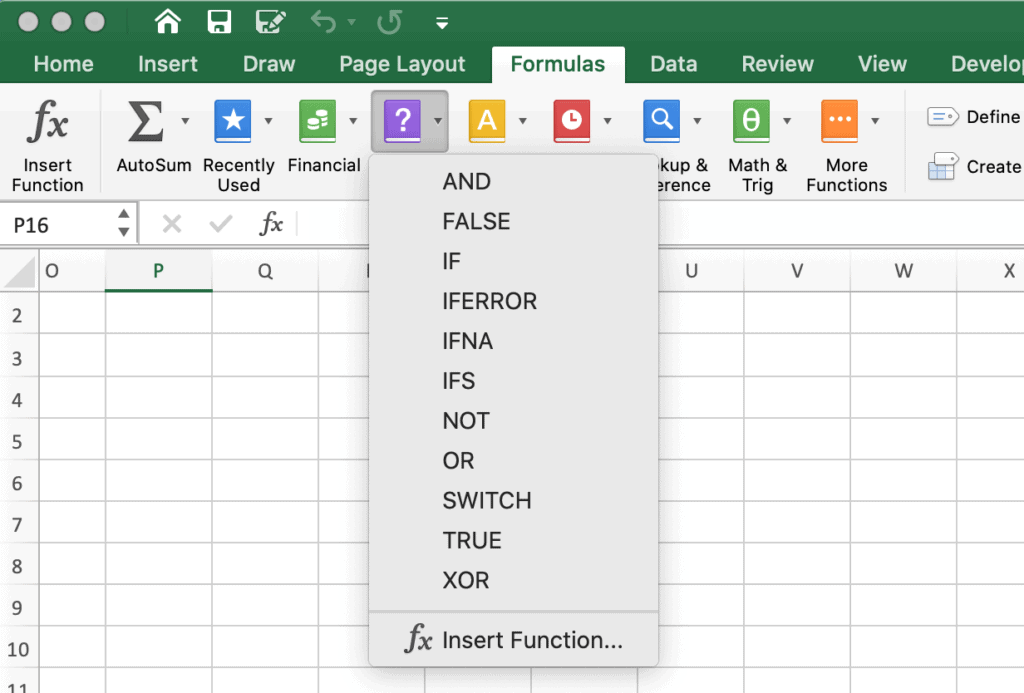
These Excel logical functions are on the Formulas ribbon and the Logical button.
Contents
Excel Logical Functions
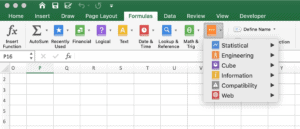
You can find a list of Excel functions in the Formulas ribbon. Each icon represents a category of functions.
- Recently Used
- Financial
- Logical
- Text
- Date & Time
- Lookup & Reference
- Math & Trig
- Statistical
- Engineering
- Cube
- Information
- Compatibility
- Web
Logical Functions Table
| Function | Description |
|---|---|
| AND | returns TRUE only if all arguments are TRUE |
| FALSE | returns the logical value FALSE |
| IF | checks whether a condition is met, returns one value if TRUE, another value if FALSE |
| IFERROR | returns a specified value if expression is an error and the function value otherwise |
| IFNA | returns a specified value if the expression is #N/A, and the function value otherwise |
| IFS | runs multiple tests and returns a value corresponding to the first TRUE result |
| NOT | changes TRUE to FALSE, or FALSE to TRUE |
| OR | returns TRUE if any arguments are TRUE |
| SWITCH | returns a result on the first matching value |
| TRUE | returns the logical value TRUE |
| XOR | returns a logical “exclusive or” of all arguments |
Using multiple IF functions in the same formula is called a nested IF function.
Excel Logical Operators
Excel uses several logical operators to show equality or inequalities.
| Operator | Description | Example |
|---|---|---|
| = | equal to | A1=E1 |
| > | greater than | A1>E1 |
| >= | greater than or equal to | A1>=E1 |
| < | less than | A1<E1 |
| <= | less than or equal to | A1<=E1 |
| <> | not equal to | A1<>E1 |
AND
Logical function used to require more than one condition at the same time. AND returns either TRUE or FALSE. Returns TRUE if all arguments are TRUE. If one argument is FALSE, it returns FALSE.
=AND (logical1, [logical2], …)
logical1 – The first condition or logical value to evaluate.
logical2 – [optional] The second condition or logical value to evaluate
FALSE
The FALSE function returns the logical value FALSE. There are no arguments but the parentheses are required.
=FALSE()
IF
The IF function can perform a logical test and returns one value if TRUE, and another value if FALSE. More than one condition can be tested by nesting IF functions. IF function can be combined with logical functions like AND and OR.
=IF (logical_test, [value_if_true], [value_if_false])
logical_test – A value or logical expression that can be evaluated as TRUE or FALSE.
value_if_true – [optional] The value to return when logical_test evaluates to TRUE.
value_if_false – [optional] The value to return when logical_test evaluates to FALSE.
IFERROR
The IFERROR function returns value_if_error if expression is an error and the value of the expression itself otherwise.
= IFERROR(value,value_if_error)
Value: is any value or expression or reference.
Value_if_error: is any value or expression or reference.
IFNA
The IFNA function returns the value you specify if the expression resolves to #N/A, otherwise returns the result of the expression.
=IFNA(value,value_if_na)
- Value: is any value or expression or reference.
- Value_if_na: is any value or expression or reference.
IFS
Runs multiple tests and returns a value corresponding to the first TRUE result. The IFS function uses multiple conditions without nested IF statements. IFS allows easier to read formulas. The IFS function can be used instead of nested IF statements.
=IFS (test1, value1, [test2, value2], …)
test1 – First logical test.
value1 – Result when test1 is TRUE.
test2 – Second logical test [optional].
value2 – Result when test2 is TRUE [optional].
The IFS function debuted in Excel 2019.
NOT
Returns the opposite of a given logical or boolean value. When given TRUE, NOT returns FALSE. When given FALSE, NOT returns TRUE. Use the NOT function to reverse a logical value.
=NOT (logical)
logical – A value or logical expression that can be evaluated as TRUE or FALSE.
OR
Logical function to test multiple conditions at the same time. OR returns either TRUE or FALSE. TRUE if any arguments evaluate TRUE; FALSE if not.
=OR (logical1, [logical2], …)
logical1 – The first condition or logical value to evaluate.
logical2 – [optional] The second condition or logical value to evaluate.
SWITCH
The SWITCH function evaluates an expression against a list of values and returns the result corresponding to the first matching value. If there is no match, an optional default value is returned.
=SWITCH(expression,value1,result1,default_or_value2,result2,…)
Expression – is an expression to be evaluated.
TRUE
The TRUE function returns the logical value TRUE. There are no arguments but the parentheses are required.
=TRUE()
XOR
Returns a logical “exclusive or” of all arguments.
XOR(logical1,logical2,…)
Logical – logical1,logical2,… are 1 to 254 conditions you want to test that can be either TRUE or FALSE and can be logical values, arrays, or references.
Excel Conditional Formatting
Conditional formatting is located on the Home ribbon and Conditional Formatting button. This identifies cells based on values such as top 10%, bottom 10, greater than, or scales of top, bottom, or middle.
Highlight Cells Rules
The highlight cells option shows numbers that are greater than, less than, equal to, some specified value. It can also be used to show duplicate values or a specific text string.
- Greater Than
- Less Than
- Between
- Equal To
- Text That Contains
- A Date Occurring
- Duplicate Values

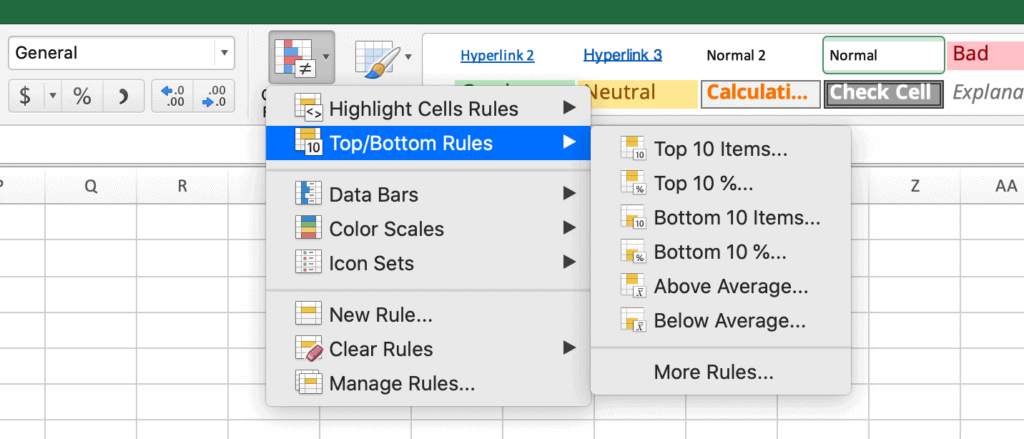
Top/Bottom Rules
Top/Bottom rules show the top 10 items, top 10%, bottom 10, bottom 10%, above average, or below average. These numbers can be changed so that only the top 3 are shown or the bottom 15% is revealed.
- Top 10 Items
- Top 10%
- Bottom 10 Items
- Bottom 10%
- Above Average
- Below Average
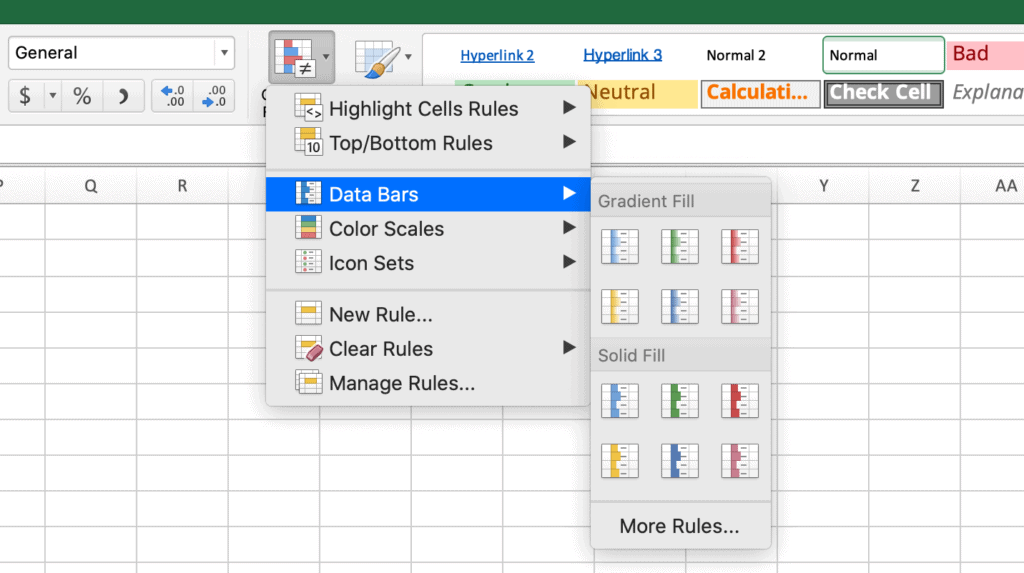
Data Bars
Data Bars show the relative size of a list of numbers. The largest numbers fill the cell with a fill color (blue, red, green, etc.). The gradient fill is more transparent and the solid fill is less transparent.
- Gradient Fill
- Solid Fill
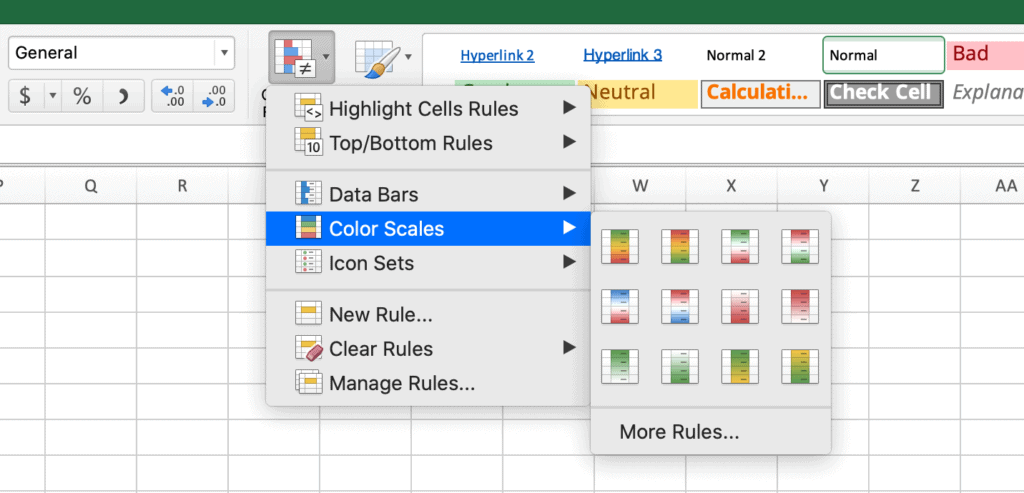
Color Scales
Color Scales show the relative size by colors in four quartiles. For example, in the Green Yellow Red scale, the higher numbers are green, the middle numbers are yellow and the smallest numbers are red.
The following list is not complete:
- Green Yellow Red – green is the highest and red is the lowest, green fades to yellow which fades to red
- Red Yellow Green – red is the highest and green is the lowest, red fades to yellow which fades to green
- Blue White Red – blue is the highest and red is the lowest, blue fades to white which fades to red
- White Red – white is the highest and fades to red the lowest
- Green White – green is the highest and fades to white the lowest
Icon Sets
Icon Sets show the data in 3, 4, or 5 categories by size.
- Directional – arrows going up, horizontal, or down
- Shapes – circles, triangles, or traffic lights
- Indicators – flags or warnings
- Ratings – stars, pie charts, and other symbols

Excel Basics Lessons for Beginners
Here are the Excel basics lessons for beginners in The Ultimate Guide to Finally Learn Excel.
- Introduction to Excel
- Statistical Analysis in Excel
- Creating Graphs in Excel
- Logical Functions in Excel
- Text Functions in Excel
- Financial Functions in Excel
- Lookup Functions in Excel
- Data Analysis in Excel
- What-if Analysis in Excel
See Also: