
Liquidity ratios show the ability of a company to pay its short-term debts. The liquidity ratios include the current ratio, quick ratio, and cash ratio.
Liquidity ratios compare current assets and current liabilities to determine a company’s ability to pay its short-term debt.
Contents
What is liquidity?
Liquidity is a financial concept about an asset’s “nearness to cash” or the ease of converting an asset to cash. Cash is the most liquid asset.
What do liquidity ratios measure?
In financial analysis, liquidity ratios help determine whether an organization can pay its bills and maintain its normal business operations. Firms with insufficient liquidity may be unable to pay their employees, their suppliers, or their operating expenses in a timely manner.
How are liquidity ratios computed?
Liquidity ratios all involve comparing current assets and current liabilities in various ways.
How do we interpret liquidity ratios?
For liquidity ratios, higher values indicate greater liquidity and therefore less risk. However, very high values may indicate inefficient management of current assets.
Liquidity ratios are somewhat tricky to interpret. It is essential for organizations to have adequate liquidity, but it is undesirable to have too much liquidity. Too much liquidity may result in lower profits and lower returns since liquid assets usually have low rates of return.
Therefore, with all liquidity ratios and metrics, both low and high ratio values raise red flags. The appropriate amount of liquidity can vary from one industry to another, so benchmarking and peer comparisons are important to identify the optimal amount of liquidity.
Summary of liquidity ratios
The liquidity tables below contain the following information:
Ratio Name
The most commonly used name of each ratio.
Ratio Formula
The preferred formula for computing this ratio. There may be more formulas for some ratios. We selected each formula based on our preference, simplicity, and common usage.
Ratio Synonym
Any widely used alternate names or acronyms.
Ratio Description
A brief description of the ratio.
Ratio Expressed
A guide to how the ratio should be expressed. Note that many ratios are properly expressed as multiples, which have no units.
Ratio Interpretation
How to interpret the ratio results. Generally speaking, this shows how to understand higher values and lower values. Remember many ratios involve some type of tradeoff. So unambiguous directional interpretation can be difficult.
Net Working Capital
Net working capital is a basic liquidity metric. The net working capital formula is current assets – current liabilities.
| Net Working Capital | Key Facts |
|---|---|
| Formula | Current assets – Current liabilities |
| Synonyms | Working capital |
| Description | Basic liquidity measure; indicates how much current assets are financed by “permanent” sources of capital. |
| Expressed | Dollars: $1,234 |
| Interpretation | Higher = more liquid = less risky; too high = Inefficient use of resources; should be positive for most firms |
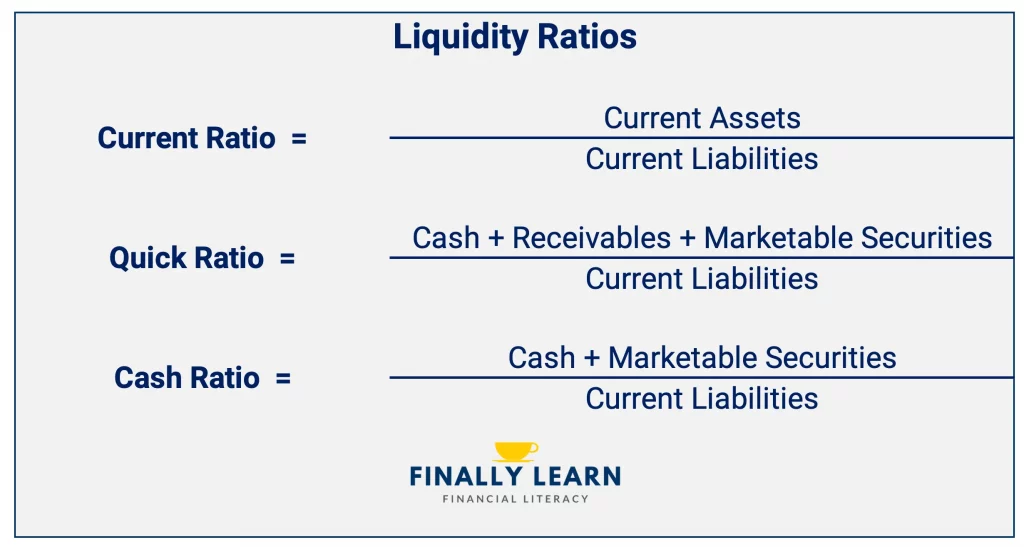
Current Ratio
The current ratio is the most common liquidity ratio. The current ratio formula is current assets / current liabilities.
| Current Ratio | Key Facts |
|---|---|
| Formula | Current Assets / Current Liabilities |
| Synonyms | Liquidity ratio; Working capital ratio |
| Description | The most commonly used liquidity ratio. |
| Expressed | Multiple: 1.23 |
| Interpretation | higher = more liquid = less risky; too high = Inefficient use of resources the current ratio should probably be around 1.50-2.00 for most firms. |
Quick Ratio
The quick ratio is a stricter test of liquidity. The quick ratio formula is (cash + receivables + marketable securities) / current liabilities.
Marketable securities are short-term investments that can be sold anytime.
| Quick Ratio | Key Facts |
|---|---|
| Formula | (Cash + Receivables + Marketable Securities) / Current Liabilities |
| Synonyms | Acid-test ratio |
| Description | Stricter test of liquidity. Inventory and prepaid items are removed from the numerator since they are the most illiquid of the current assets. |
| Expressed | Multiple: 1.23 |
| Interpretation | higher = more liquid = less risky; too high = Inefficient use of resources the quick ratio should probably 1.00 or higher for most firms. |
Cash Ratio
The cash ratio is the strictest liquidity test. The cash ratio formula is (cash + marketable securities) / current liabilities.
Marketable securities are also called short-term investments.
| Cash Ratio | Key Facts |
|---|---|
| Formula | (Cash + Marketable Securities) / Current Liabilities |
| Synonyms | – |
| Description | Strictest test of liquidity. Focuses only on truly liquid assets. |
| Expressed | Multiple: 1.23 |
| Interpretation | higher = more liquid = less risky too high = inefficient use of resources. |
Burn Rate
| Burn Rate | Key Facts |
|---|---|
| Formula | Net cash used per month (can also be stated per day, per week, etc.) |
| Synonyms | – |
| Description | Typically used by firms with negative cash flow. Very commonly used in venture capital to estimate funding needs. |
| Expressed | Dollars per time period: $10,500 per month |
| Interpretation | Higher = More Cash Usage = Higher Cash Needs |
Days Cash on Hand
| Days Cash on Hand | Key Facts |
|---|---|
| Formula | Cash / One-day cash requirement |
| Synonyms | – |
| Description | Used by nonprofits and other organizations with uneven cash inflows to estimate how many more days of operations can be funded from current cash. |
| Expressed | Days: 12.34 Days |
| Interpretation | Higher = More Days of Operations = Safer |
Limitation: False Liquidity
The liquidity ratios all compare current assets to current liabilities in some way. Higher levels of current assets compared to current liabilities are typically interpreted as creating greater liquidity. However, in certain situations, this may not be true.
Two of the current assets, inventory and accounts receivable, may be artificially high in some cases. Inventory may include the value of products that have little chance of being sold. This is due to obsolescence or lack of demand in the market.
Accounts receivable may include the value of accounts that have little chance of being collected because of age or a variety of other factors.
In short, it is possible that the inventory and accounts receivable numbers that influence most of the liquidity ratios are “optimistic.” Obviously, firms should write off inventory that cannot be sold and receivables that cannot be collected. However, firms may not always do this in a timely manner.
Opportunity Cost and Liquidity Ratios
One of the challenges in interpreting any of the liquidity ratios is that it is possible to have too much liquidity. Higher values for any of the liquidity ratios indicate more liquidity and thus, lower risk.
However, very high values may indicate that current assets are being managed inefficiently, thus reducing the firm’s returns. This is due to the opportunity cost of holding too many current assets.
Opportunity costs and low returns
This opportunity cost is caused by the low returns that current assets earn. This is compared to more productive long-term assets.
- The rate of return on “true” cash is zero.
- The return on marketable securities is typically tied to short-term interest rates. However, these rates are usually low.
- The return on inventory is typically negative. This is due to obsolescence, theft, or damage.
- The rate of return on receivables is typically negative. Some accounts will not be collected.
Due to these low returns, firms should try to minimize current assets as much as possible given the constraints of their business models and economic reality. Obviously, firms need to hold cash and inventory. However, holding excess current assets leads to inefficiency and opportunity costs.
Opportunity cost example
This opportunity cost is easy to show with a simple example.
Assume we have two firms that are completely identical except for the total current assets. Basic financial information about the firms appears below:
| Financial Data | Firm A | Firm B |
|---|---|---|
| Current Assets | $1,000 | $3,000 |
| Fixed Assets | 4,000 | 4,000 |
| Total Assets | 5,000 | 7,000 |
| Net Income | 700 | 700 |
| Current Liabilities | 500 | 500 |
| Current Ratio | 2.00 | 6.00 |
| Return on Assets (ROA)* | 14.00% | 10.00% |
In the example above, Firm A has good liquidity with a current ratio of 2.00. Firm B has higher liquidity at 6.00. However, it is too high. It must hold more current assets, thus increasing its total assets. Increasing assets reduce its return on assets (ROA).
It is difficult to determine the optimal amount of liquidity for a firm. However, there is a trade-off. More liquidity is safer. But, too much liquidity imposes opportunity costs on the firm through lower returns.