
The current ratio estimates an entity’s ability to pay its short-term debts. The current ratio formula is current assets divided by current liabilities.
A current ratio of 1.5 to 2.0 is good, and a current ratio less than 1.0 is poor.
Contents
What is the current ratio?
The current ratio measures the firm’s ability to pay its short-term debts. Current assets and current liabilities have a maturity of less than one year. So, the current ratio shows the firm’s ability to pay its debts over the next year.
It measures the ratio of current assets to current liabilities. Higher values show greater liquidity and a stronger financial position. Lower values show less liquidity.
Creditors are interested in the current ratio and other liquidity ratios since higher values show a greater probability of repayment.
The current ratio needs to be high enough to provide financial stability and basic liquidity for the firm. 1.00 is generally considered the minimum acceptable value.
With a current ratio of 1.00, the firm could theoretically pay all its current liabilities using only its current assets. Higher values indicate more liquidity and a greater ability to survive bad times.
What is the current ratio formula?
The current ratio formula is current assets / current liabilities. Current assets and current liabilities are both shown on the balance sheet.
Current Assets
Current assets are short-term assets expected to be used or converted to cash within one year. Examples of current assets include:
- cash
- receivables
- inventory
- marketable securities
- prepaid expenses
Current Liabilities
Current liabilities are short-term debts due within one year. These current liabilities include:
- accounts payable
- wages payable
- income tax payable
- notes payable (short-term)
- other short-term debts
How to calculate the current ratio

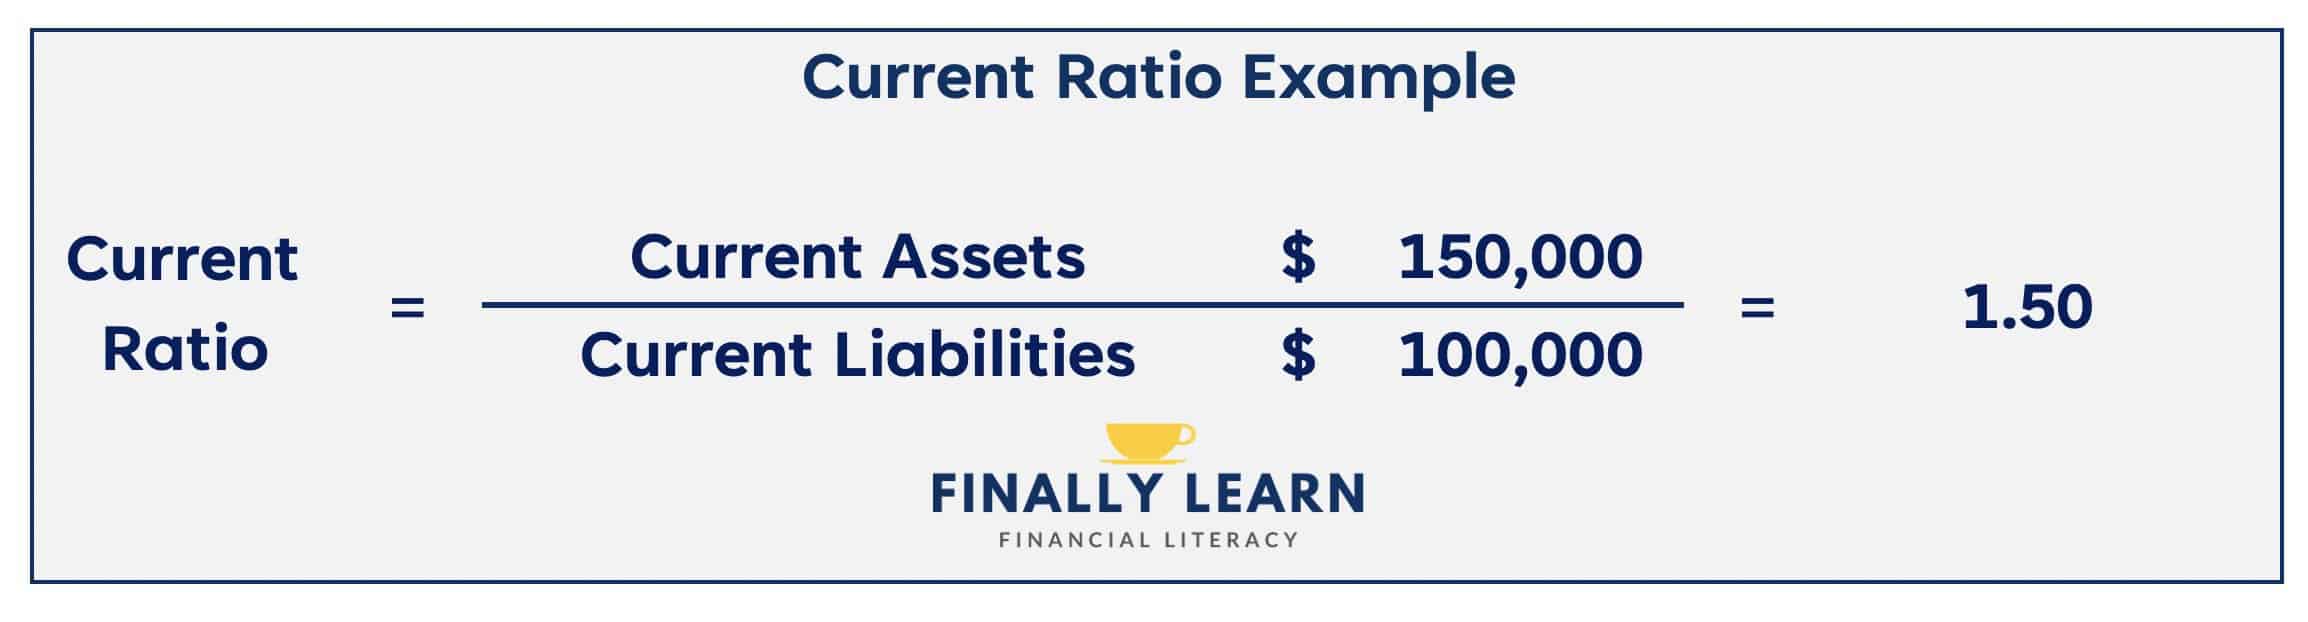
For example, assume current assets are $150,000 and current liabilities are $100,000. The current ratio shows 1.50. So, for every dollar in current liabilities, the company has $1.50 in current assets.
Walmart 2022 current ratio
To compute the current ratio, we need information from the balance sheet. Here is information from the Walmart Inc. 2022 Balance Sheet:
| Walmart Inc. | 2022 |
|---|---|
| Current Assets | |
| Cash | $14.760 |
| Receivables | 8,280 |
| Inventory | 56,511 |
| Other current assets | 1,519 |
| Current Assets | $81,070 |
| Current Liabilities | $87,379 |
The current ratio for Walmart Inc. in 2022 is:
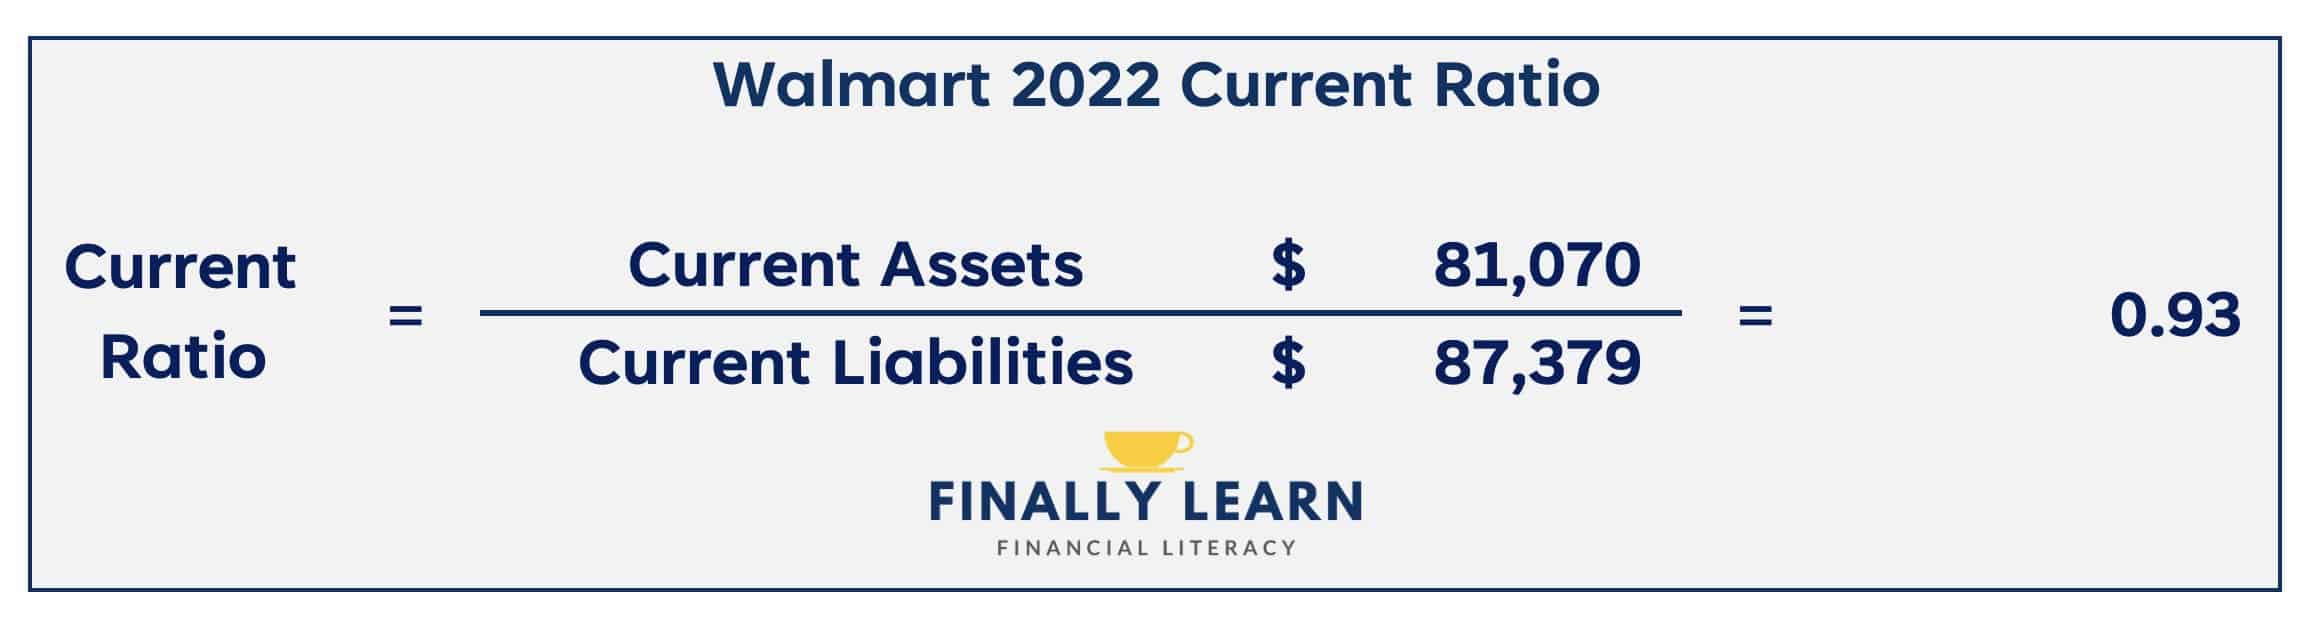
The current ratio in this example is 0.93. So, for every $1.00 of current liabilities, there are $0.93 of current assets.
How is the current ratio expressed?
The current ratio is expressed as a multiple. So, based on the problem above, the current ratio is 1.50.
The current ratio should not be expressed as a percent. The answer of 1.50 shows current assets are 150% of current liabilities. However, showing a percentage causes confusion.
It is correct, though rare, to show the value as 1.50x or 1.50:1. The best answer is 1.50.
Current ratio key facts
| Current Ratio | Key Facts |
|---|---|
| Definition | Ability to pay short-term debts |
| Formula | Current Assets / Current Liabilities |
| Expressed | As a multiple: e.g. 1.25 |
| Financial Statement | Assets: balance sheet Liabilities: balance sheet |
| Category | Liquidity Ratios |
| Alternate Names | Liquidity Ratio Working Capital Ratio |
| Alternate Formula | None |
| Interpretation | Higher = less risk Lower = more risk |
| Limitations | Too High = inefficient and lower returns |
| Notes | Most popular liquidity ratio |
Liquidity ratios
Liquidity ratios show the company’s ability to pay its bills and maintain normal operations. Liquidity ratios include:
- current ratio
- net working capital
- quick ratio
- cash ratio
Alternate names
There are two synonyms for the current ratio:
- Working Capital Ratio
- Liquidity Ratio
Alternate formula
There are no alternate formulas for the current ratio. It is one of the few ratio formulas with no alternate formulas.
Current ratio interpretation
The basic interpretation of the current ratio is:
- Lower = Less Liquid = More Risky
- Higher = More Liquid = Less Risky
- Too High = Inefficient Use of Resources = Lower Returns
What is a good current ratio?
Generally, 1.50 to 2.00 are good values for the current ratio. Historically, values around 2.00 indicated adequate liquidity and stability. This value has decreased in recent years, with values around 1.50 now accepted as good for many firms.
As with many ratios, “good” values are industry-specific. Values well above 1.50 are common in some industries, while values below 1.50 may be adequate in others. However, higher values are always safer in an absolute sense.
To illustrate, all U.S. listed companies had a median current ratio of 1.94 in 2020.
For general merchandise retailers, the ratio was 1.35. However, Costco, Target, and Walmart all had current ratios around 1.00. These companies rely on strong cash flow to pay for their current debts.
| 2020 | Current Ratio |
|---|---|
| Costco | 0.99 |
| Target | 1.03 |
| Walmart | 0.97 |
| All Retailers (median) | 1.35 |
| All U.S. Companies (median) | 1.94 |
What if current ratio is too low?
Low current ratio values, even below 1.00, do not necessarily signal a financial crisis for the firm. The ability to repay short-term obligations is determined not just by the firm’s current assets, but also by its cash flows.
Firms with high enough cash flow may be able to maintain lower current assets and still comfortably repay short-term debts. For example, a firm with mostly cash sales and high inventory turnover will typically have low accounts receivable and inventory balances.
If we assume that the firm reinvests its cash inflows, then this firm will have low current assets. However, due to the nature of its business (cash sales and rapid inventory turnover), this firm is probably quite liquid – even if it has high current liabilities.
To calculate the current ratio, see the Current Ratio Calculator
What if current ratio is too high?
There are two important points to note regarding high values for the current ratio:
- It is possible that high values indicate “false liquidity”
- Values that are “too high” impose an opportunity cost on the firm in the form of lowered returns.
Limitation: false liquidity
The liquidity ratios all compare current assets to current liabilities in some way. Higher levels of current assets compared to current liabilities are typically interpreted as creating greater liquidity. However, in certain situations, this may not be true.
Two of the current assets, inventory and accounts receivable, may be artificially high in some cases. Inventory may include the value of products that have little chance of being sold. This is due to obsolescence or a lack of demand in the market.
Accounts receivable may include the value of accounts that have little chance of being collected because of age or a variety of other factors.
In short, it is possible that the inventory and accounts receivable numbers that influence most of the liquidity ratios are “optimistic.” Obviously, firms should write off inventory that cannot be sold and receivables that cannot be collected. However, firms may not always do this in a timely manner.
Opportunity cost and liquidity ratios
One of the challenges in interpreting any of the liquidity ratios is that it is possible to have too much liquidity. Higher values for any of the liquidity ratios indicate more liquidity and, thus, lower risk.
However, very high values may indicate that current assets are being managed inefficiently, thus reducing the firm’s returns. This is due to the opportunity cost of holding too many current assets.
Opportunity costs and low returns
The low returns that current assets generate are to blame for this opportunity cost. This is compared to more productive long-term assets.
- The rate of return on “true” cash is zero.
- The return on marketable securities is typically tied to short-term interest rates. However, these rates are usually low.
- The return on inventory is typically negative. This is due to obsolescence, theft, or damage.
- The rate of return on receivables is typically negative. Some accounts will not be collected.
Due to these low returns, firms should try to minimize current assets as much as possible given the constraints of their business models and economic reality. Obviously, firms need to hold cash and inventory. However, holding excess current assets leads to inefficiency and opportunity costs.
Opportunity cost example
This opportunity cost is easy to show with a simple example.
Assume we have two firms that are completely identical except for their total current assets. Basic financial information about the firms appears below:
| Financial Data | Firm A | Firm B |
|---|---|---|
| Current Assets | $1,000 | $3,000 |
| Fixed Assets | 4,000 | 4,000 |
| Total Assets | 5,000 | 7,000 |
| Net Income | 700 | 700 |
| Current Liabilities | 500 | 500 |
| Current Ratio | 2.00 | 6.00 |
| ROA* | 14.00% | 10.00% |
In the example above, Firm A has good liquidity with a current ratio of 2.00. Firm B has higher liquidity at 6.00. However, it is too high. It must hold more current assets, thus increasing its total assets. Increasing assets reduces its return on assets (ROA).
It is difficult to determine the optimal amount of liquidity for a firm. However, there is a trade-off. More liquidity is safer. But, too much liquidity imposes opportunity costs on the firm through lower returns.