
Excel has many important financial functions. Here are the top 15 Excel financial functions to improve your financial analysis and financial decisions.
Contents
Top 15 Excel financial functions
Financial analysis and decision-making are integral components of any organization’s operations. Excel, with its many financial functions, is an indispensable tool for financial professionals.
The financial functions in Excel use time value of money (TVM) calculations to solve financial problems.
See more at Financial Functions in Excel.
Here are the top 15 Excel financial functions that help you solve financial calculations and improve your decision-making.
| Number | Top 15 Financial Functions |
|---|---|
| 1 | FV |
| 2 | PV |
| 3 | PMT |
| 4 | RATE |
| 5 | NPER |
| 6 | NPV |
| 7 | IRR |
| 8 | XNPV |
| 9 | XIRR |
| 10 | MIRR |
| 11 | FVSCHEDULE |
| 12 | STOCKHISTORY |
| 13 | PPMT |
| 14 | RRI |
| 15 | EFFECT |
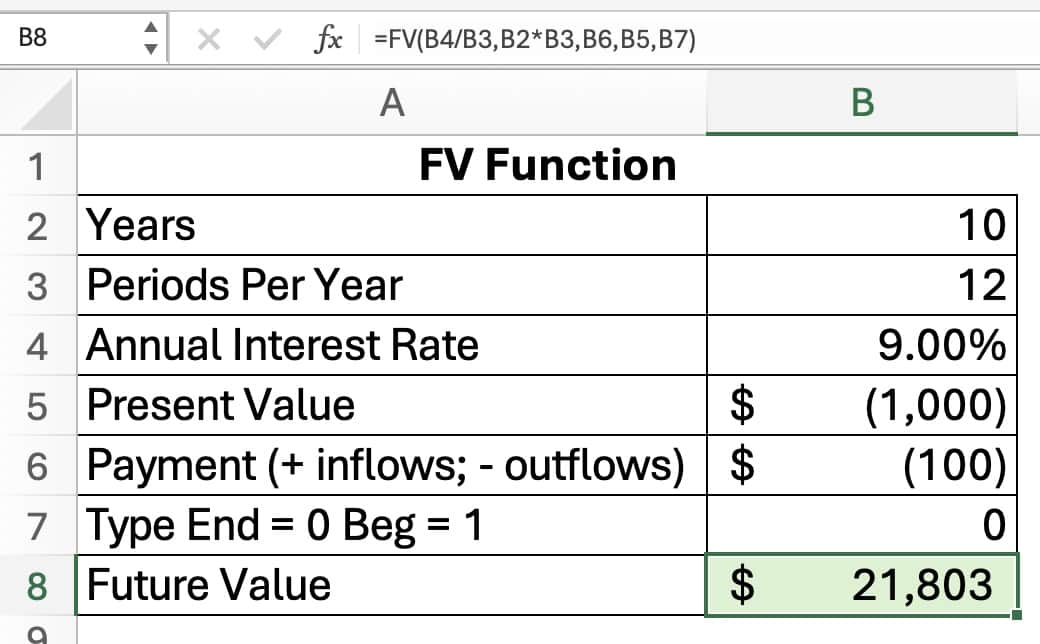
1. FV function
The FV function calculates the future value of an investment or an annuity. It considers the initial investment, periodic payments, interest rate, and compounding frequency.
FV function is useful when planning for retirement, estimating the growth of investments, or evaluating the profitability of long-term projects.
FV function syntax
The syntax for the FV function is:
= FV(rate,nper,pmt,[pv],[type])
- rate: interest rate per period. If it is an annual interest rate, divide it by the number of compounding periods per year.
- nper: total number of payment periods, usually months, quarters, or years.
- pmt: periodic payment
- [pv]: optional argument for present value. If omitted, Excel assumes a value of 0.
- [type]: optional, indicates whether payments are made at the beginning (1) or end (0) of each period. The default is 0.
FV function example
Mary invests $1,000 in an account that grows at 9% per year, compounded monthly. She adds $100 per month. What is the account balance at the end of 10 years?
The future value is $21,803.
If you enter the cash outflows as negative, the future value will be positive because it is a cash inflow.
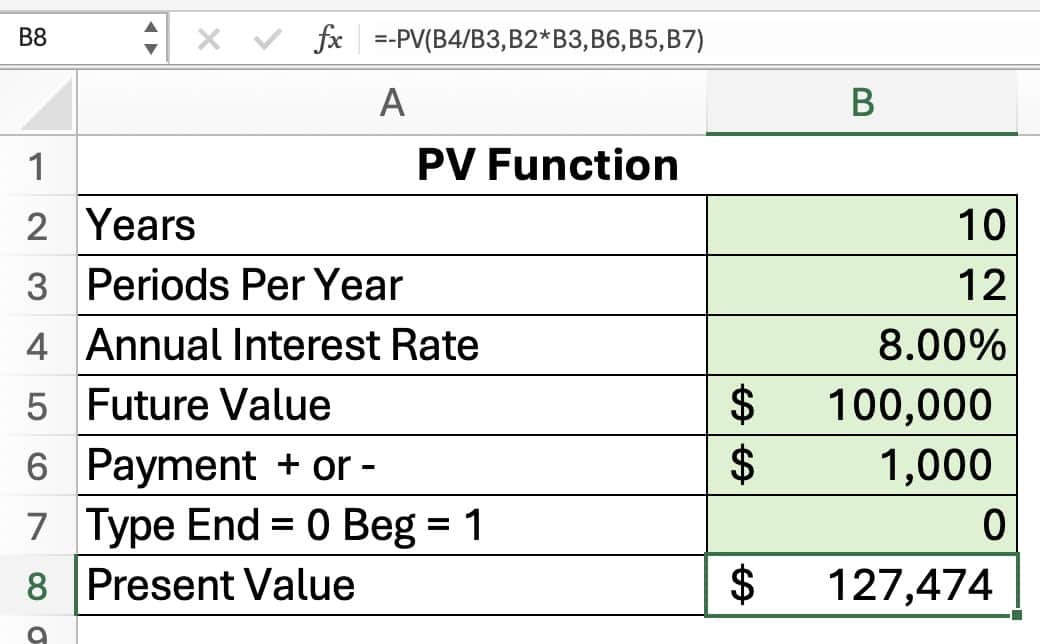
2 PV function
The PV function calculates the present value of an investment or a series of cash flows. The PV function evaluates the value of cash flows in today’s dollars.
Excel’s PV function determines the value of future cash flows in present dollars.
The interest rate represents the cost of capital or the expected return on investment. The number of periods indicates how many times interest will compound over time.
PV function syntax
The PV function syntax is:
= PV(rate, nper, pmt, [fv], [type]).
- rate: the interest rate per period. If it is an annual interest rate, divide it by the number of compounding periods per year.
- nper: the total number of payment periods, usually months, quarters, or years.
- pmt: periodic payment; cash receipts are positive and cash payments are negative
- [fv]: optional argument for future value. If omitted, Excel assumes a value of 0.
- [type]: optional, indicates whether payments are made at the beginning (1) or end (0) of each period. The default is 0.
PV function example
Justin will receive $1,000 per month for 10 years. At the end of the 10 years, he will receive a $100,000 payment. If the discount rate is 8%, what is the present value of the cash flows?
The present value is $127,474.
If the payments and the future value are positive, the present value will be negative. Notice, the negative sign at the beginning of the formula, to show the present value as a positive number.
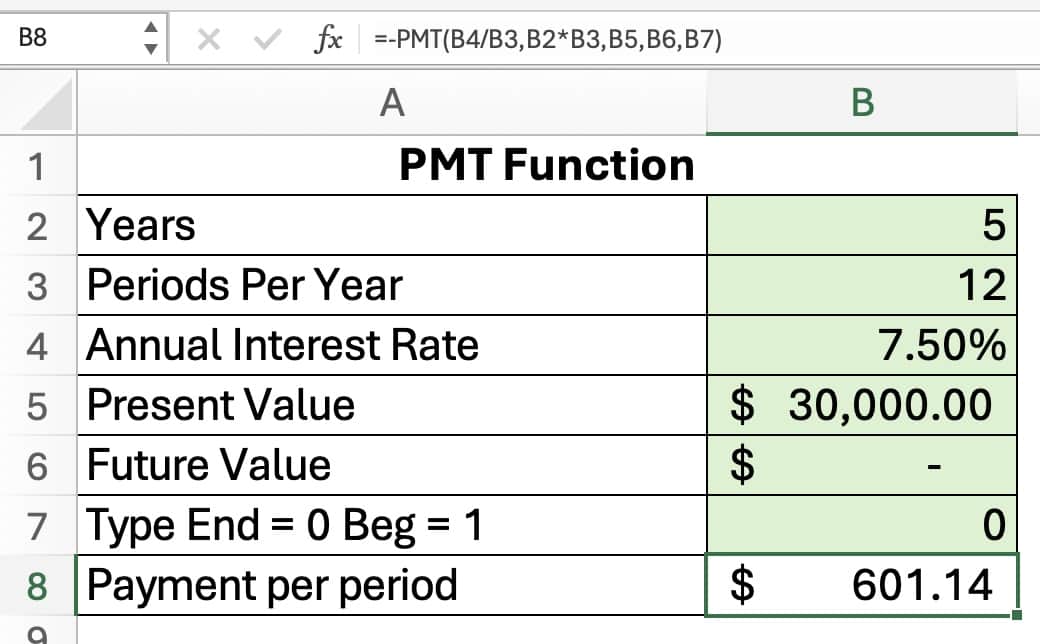
3 PMT function
The PMT function calculates the periodic payment for a loan or an investment. The PMT function assumes a fixed interest rate, constant payment amounts, and a specific number of periods.
An example using the PMT function is calculating the payment on a loan.
PMT function syntax
The syntax for the PMT function is:
= PMT(rate, nper, pv, [fv], [type]).
- rate: interest rate per period, expressed as a decimal
- nper: total periods of the investment or loan
- pv: present value, representing the initial investment or the loan amount; cash inflows are positive and cash outflows are negative
- [fv]: optional argument for future value. If omitted, Excel assumes a value of 0.
- [type]: optional, indicates whether payments are made at the beginning (1) or end (0) of each period. The default is 0.
PMT function example
To calculate a car payment, use the PMT function. For example, Riley borrows $30,000 to buy a car. The terms are 60 months at 7.5%. Assume the payments happen at the end of the month. What is the car payment?
The car payment is $601.14.
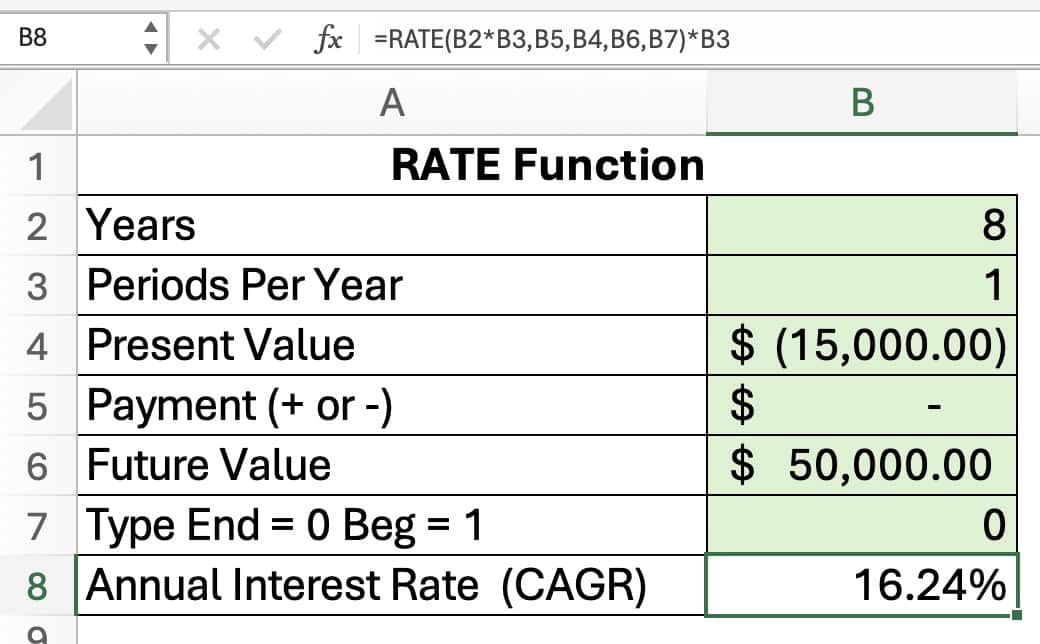
4 RATE financial function
The RATE financial function calculates the interest rate of a loan or an investment. The RATE function calculates the interest rate per period.
RATE function syntax
The RATE function syntax is
= RATE (nper, pmt, pv, [fv], [type], [guess])
- nper: total number of periods
- pmt: payment amount per period
- pv: present value
- fv: optional, the future value or balance after last payment; default is 0
- type: optional, when payments occur; 0 = end of period. 1 = beginning of period; default is 0
- guess: optional, guess of the rate; default is 0.10 or 10%
The RATE function calculates by iteration.
RATE function example
Steve invested $15,000 in an account 8 years ago. The investment is now worth $50,000. What is the compound annual growth rate? Assume annual compounding.
The annual return is 16.24%.
Note that cash outflows are negative and cash inflows are positive. If both PV and FV are entered as positive, there will be a #NUM error.
5 NPER financial function
The NPER financial function computes the number of periods in a financial problem. The NPER function is used to find the number of periods required to pay off a loan.
NPER function syntax
The NPER function syntax is:
=NPER (rate, pmt, pv, [fv], [type])
- rate: interest rate per period
- pmt: payment made each period
- pv: present value, or total value of all payments now
- fv: [optional] the future value, or a cash balance after the last payment is made; default is 0
- type: [optional] When payments are due. 0 = end of period. 1 = beginning of period; default is 0
NPER function example
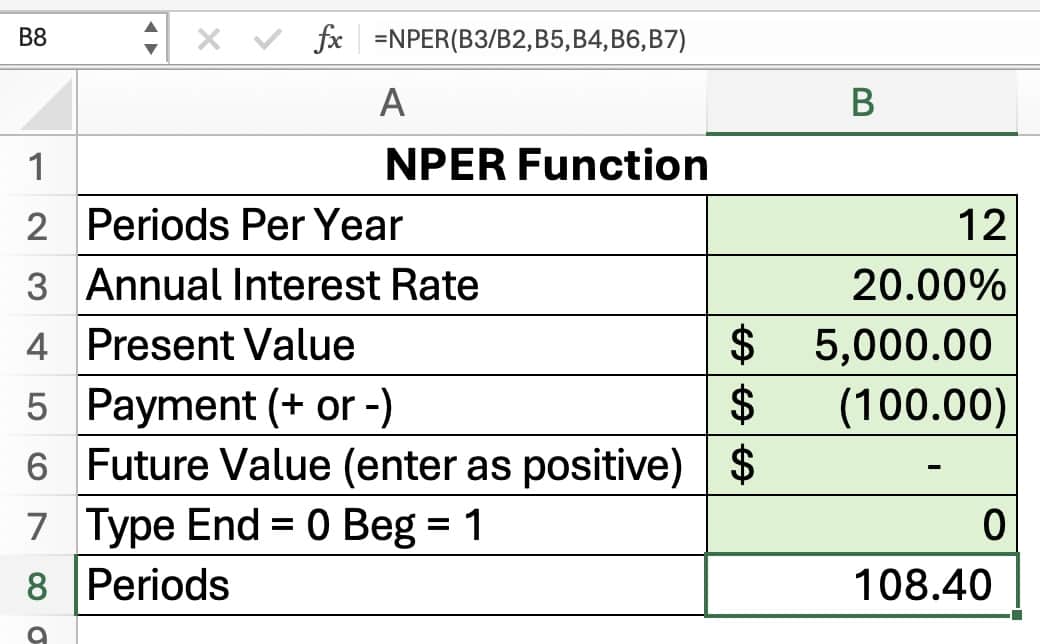
Larry has a credit card with a $5,000 balance. The annual percentage rate (APR) of the credit card is 20%. I
f Larry makes a monthly payment of $100, how many months would it take to pay off the credit card?
It will take 108.4 months to pay off the credit card. This is 9 years!
Credit card debt is very expensive. You should avoid credit card debt. If you do have credit card debt, pay it off as soon as possible.
See The Ultimate Guide to Learn Excel Basics
6 NPV financial function
The NPV financial function in Excel helps analyze the profitability of an investment by comparing the present value of cash inflows and outflows.
The NPV function uses the time value of money to determine whether an investment is profitable.
The Excel NPV function compares the initial investment and the subsequent cash flows for a project.
NPV function syntax
The NPV function has the following syntax:
= NPV (rate, value1, value2,…)
- rate: the discount rate over the length of one period entered as a decimal
- value1: value1, value2,… 1 to 254 payments, with equal periods occurring at the end of each period. Cash payments or cash outflows are negative. Cash receipts and cash inflows are positive.
To interpret NPV, accept the project if net present value is positive. Reject when the NPV is negative.
| NPV | Interpretation |
|---|---|
| NPV > $0 | Accept the project |
| NPV < $0 | Reject the project |
NPV function example
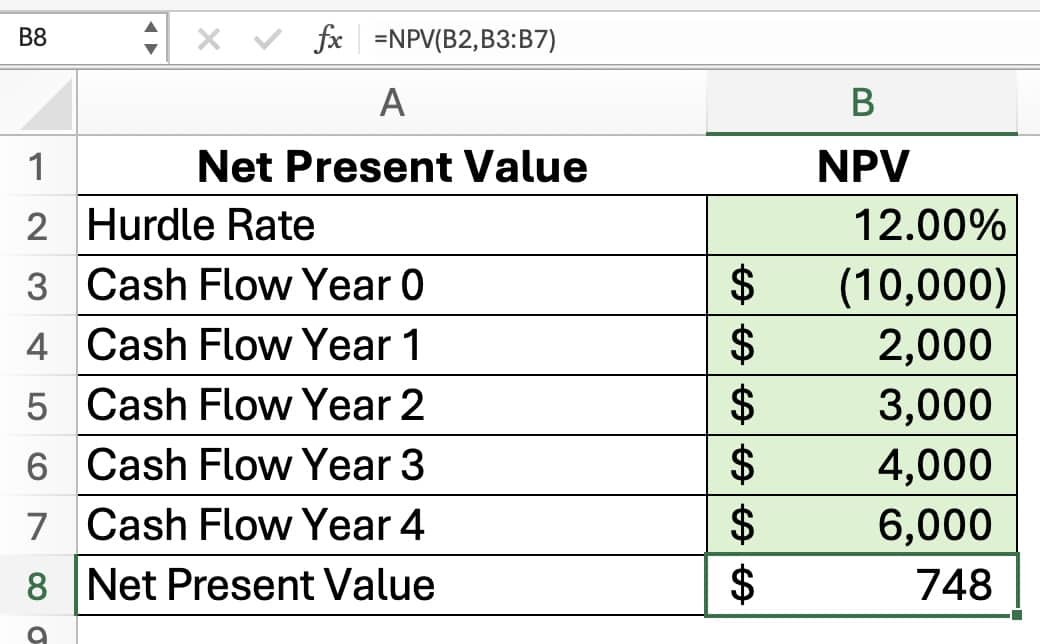
Carr, Inc. is considering a project costing $10,000. It is expected to provide four years of positive cash flows: $2,000, $3,000, $4,000, and $6,000, respectively.
Carr needs a 12% required return, or hurdle rate, on all projects. What is the projected net present value (NPV)?
The NPV for the project is a positive $748, so the project would be accepted.
7 IRR financial function
The IRR financial function measures the return of an investment by calculating the internal rate of return, or IRR. The IRR is the rate at which the net present value (NPV) equals zero.
The IRR function can analyze projects with equal periods but irregular cash flows
To calculate the IRR, you need to provide Excel with two inputs: a range of cash flows and an optional guess rate. The cash flows represent both positive and negative values over time, reflecting investments and returns.
IRR function syntax
The syntax for the IRR function is:
=IRR (values, [guess])
- Values – cash outflows are negative and cash inflows are positive
- Guess – [optional]; a number that you guess is close to the result of IRR; 0.10 or 10% if omitted.
There must be at least one negative value and one positive value in the cash flows.
A higher IRR indicates a better return on investment (ROI), making it more attractive for potential investors.
A disadvantage of IRR is that it does not consider an investment’s size or duration.
For example, a 10% return on $1 million is $100,000, but a 20% return on $200,000 is only $40,000. An investor would prefer the $100,000 gain over the $40,000 if the projects were similar in risk and duration.
To interpret the IRR, projects would require a minimum acceptable rate of return called the hurdle rate. Any project with a projected IRR above the hurdle rate would be accepted.
| IRR | Interpretation |
|---|---|
| IRR > hurdle rate | Accept the project |
| IRR < hurdle rate | Reject the project |
IRR function example
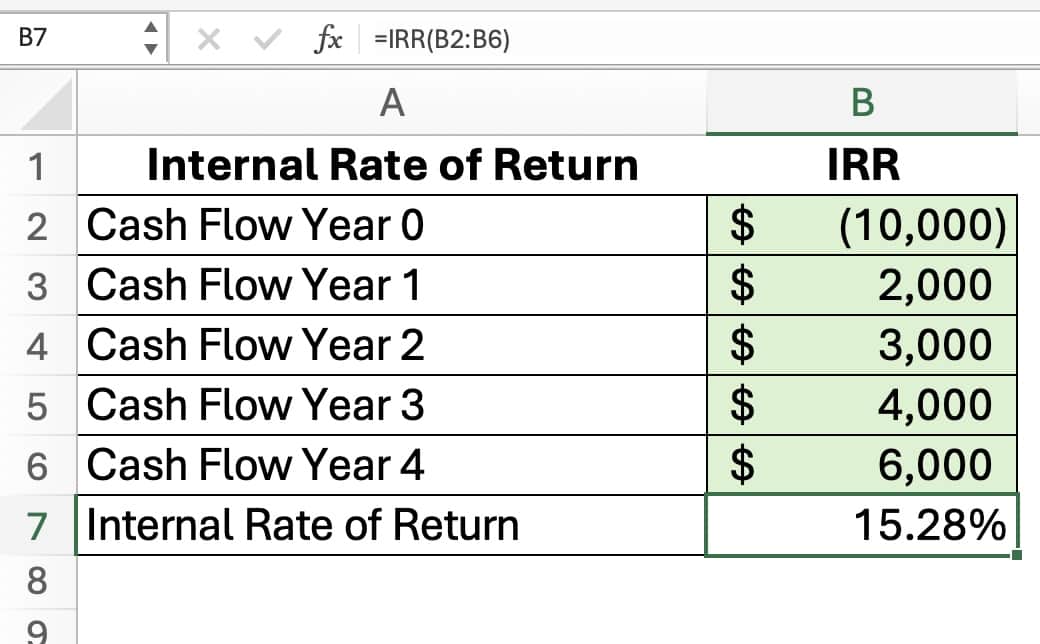
Carr, Inc. is considering a project costing $10,000. It is expected to provide four years of positive cash flows: $2,000, $3,000, $4,000, and $6,000, respectively.
Carr has a 12% required return, or hurdle rate, on all projects.
What is the projected internal rate of return (IRR)?
The IRR for the project is 15.28%, which is greater than the hurdle rate of 12%. So, the project would be accepted.
8 XNPV financial function
The XNPV function solves for the net present value using specific dates. The NPV function assumes equal time periods. The XNPV can use varying time periods.
To use XNPV, you need two columns of data: one for the cash flows and another for their corresponding dates. The cash flows can be positive for inflows and negative for outflows.
XNPV function syntax
The syntax for the XNPV function is:
= XNPV(rate, values, dates)
- rate: hurdle rate or required rate of return
- values: the cash flows; + for inflows and – for outflows
- dates: dates of the cash flows
XNPV function example
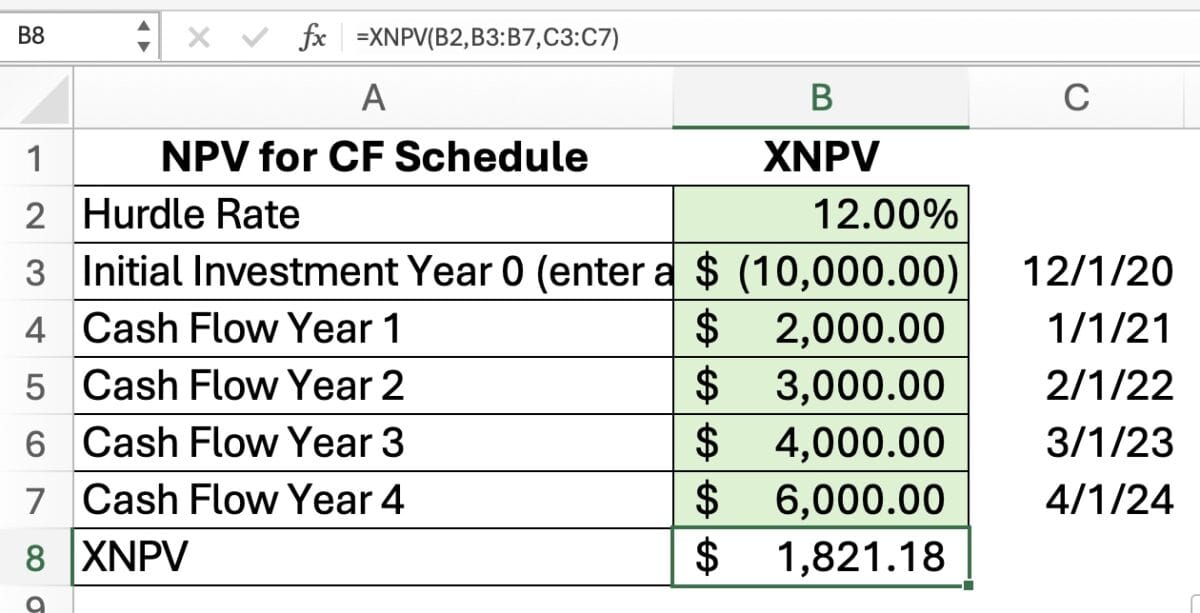
Holladay Corp. is considering a project with a cost of $10,000. The cash flows and dates are shown below. Holladay requires a 12% hurdle rate to accept any project.
What is the net present value of the project?
The NPV is a positive $1,821. So, they should accept the project.
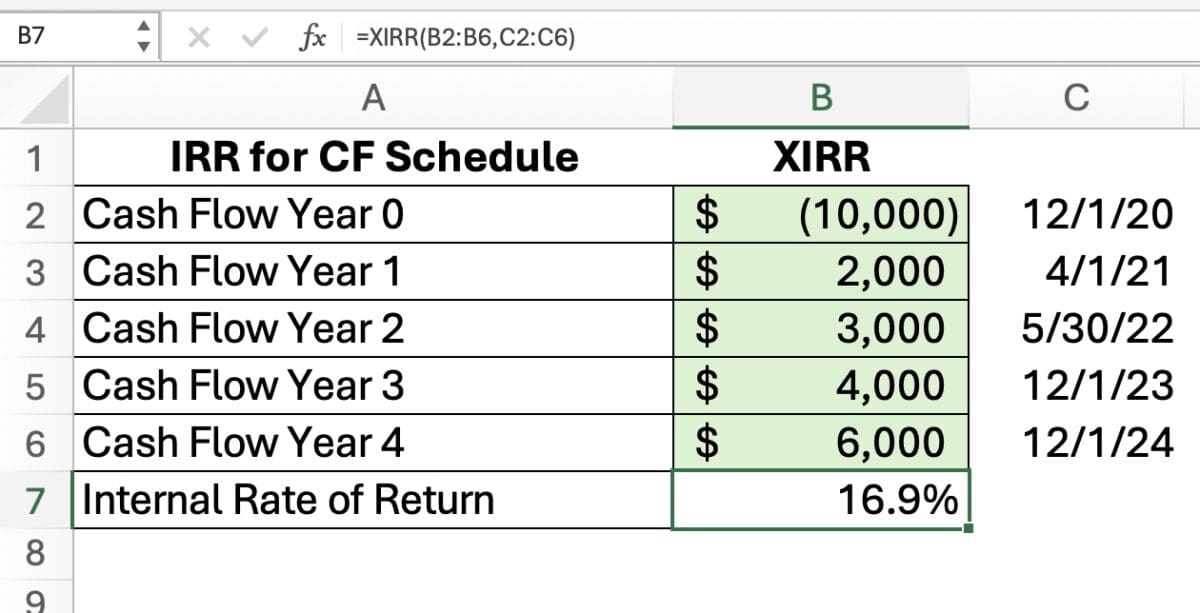
9 XIRR financial function
The XIRR function calculates the internal rate of return for uneven time periods. The IRR function assume equal time periods. If you have unequal time periods, use the XIRR function.
XIRR function syntax
The XIRR syntax is:
= XIRR (values, dates, guess)
- values: the cash flows; + for inflows and – for outflows
- dates: dates of the cash flows
- guess: optional, the default is 0.10 or 10%
XIRR function example
Foster, Inc. is considering a project costing $10,000. The timing and amounts of the cash flows are below.
Foster has a 11% required return, or hurdle rate, on all projects.
What is the projected internal rate of return (IRR)?
The IRR for the project is 16.9%, which is greater than the hurdle rate of 11%. So, the project would be accepted.
.
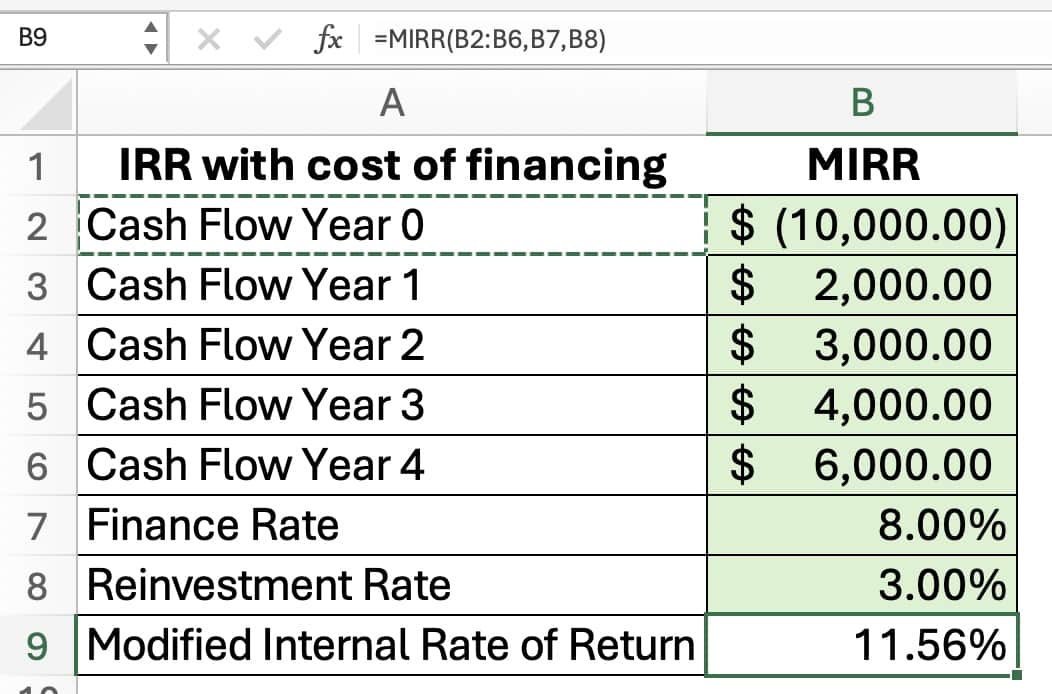
10 MIRR financial function
The MIRR function calculates the modified internal rate of return, or MIRR. The MIRR function accounts for both the cost of financing and reinvestment rates.
The IRR function ignores the cost of financing and assumes the cash flows are reinvested at the IRR.
MIRR function syntax
The MIRR function syntax is:
= MIRR (values, finance_rate, reinvest_rate)
- values: the cash flows; + for inflows and – for outflows
- finance_rate: interest rate paid for money used in the cash flows
- reinvest_rate: interest rate received on the cash flows as reinvested
MIRR function example
Harris, Inc. is considering a project costing $10,000. The amounts of the cash flows are below.
Harris pays 8% on financing costs and reinvests cash flows at 3%.
Harris has a 10% required return, or hurdle rate, on all projects.
What is the projected internal rate of return (IRR)?
The IRR for the project is 11.56%, which is greater than the hurdle rate of 10%. So, the project would be accepted.
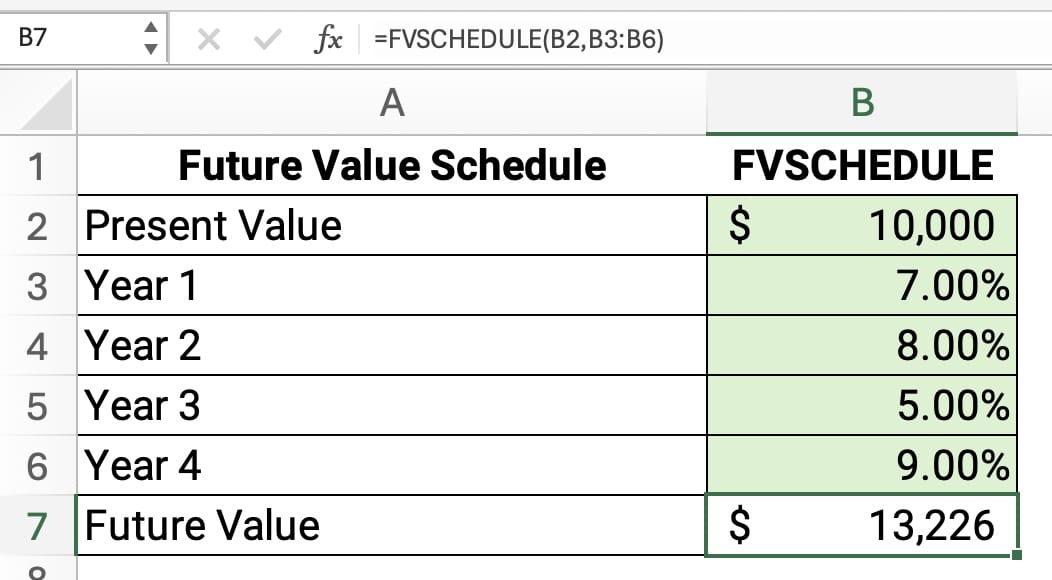
11 FVSCHEDULE financial function
The FVSCHEDULE function calculates the future value of a project with different annual discount rates.
The FV function uses the same discount rate for all periods. The FVSCHEDULE uses a different rate for each period.
FVSCHEDULE function syntax
The FVSCHEDULE function syntax is:
= FVSCHEDULE (principal, schedule)
▪ principal: is the present value
▪ schedule: is an array of interest rates
FVSCHEDULE function example
Paul invests $10,000 over 4 years. The returns vary for each of the years. See the schedule below.
What is the future value of the investment?
The future value is $13,226.
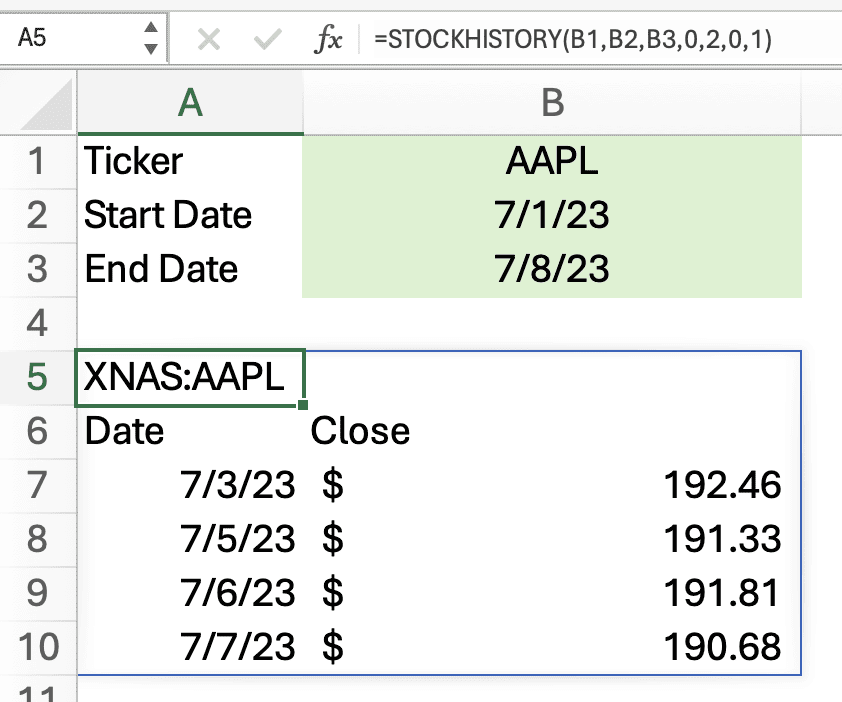
12 STOCKHISTORY financial function
The STOCKHISTORY function allows users to retrieve historical stock market data for a specific security.
STOCKHISTORY function syntax
The syntax of the STOCKHISTORY function is:
= STOCKHISTORY(stock,start_date,end_date,interval,headers,properties1,…)
- stock: the ticker of a stock; e.g. AAPL for Apple, Inc.
- start_date: the first date of the series
- end_date: the last date of the series
- interval: 0 – daily; 1 – weekly; 2 – monthly
- headers: 0 – no header; 1 – header; 2 – ticker and header
- properties: 0 – date; 1 – close; 2 – open; 3 – high; 4 – low; 5 – volume
STOCKHISTORY function example
- stock: APPL
- start_date: July 1, 2023
- end_date: July 8, 2023
- interval: 0 – daily
- headers: 2 – ticker and header
- properties: 0 – date; 1 – close
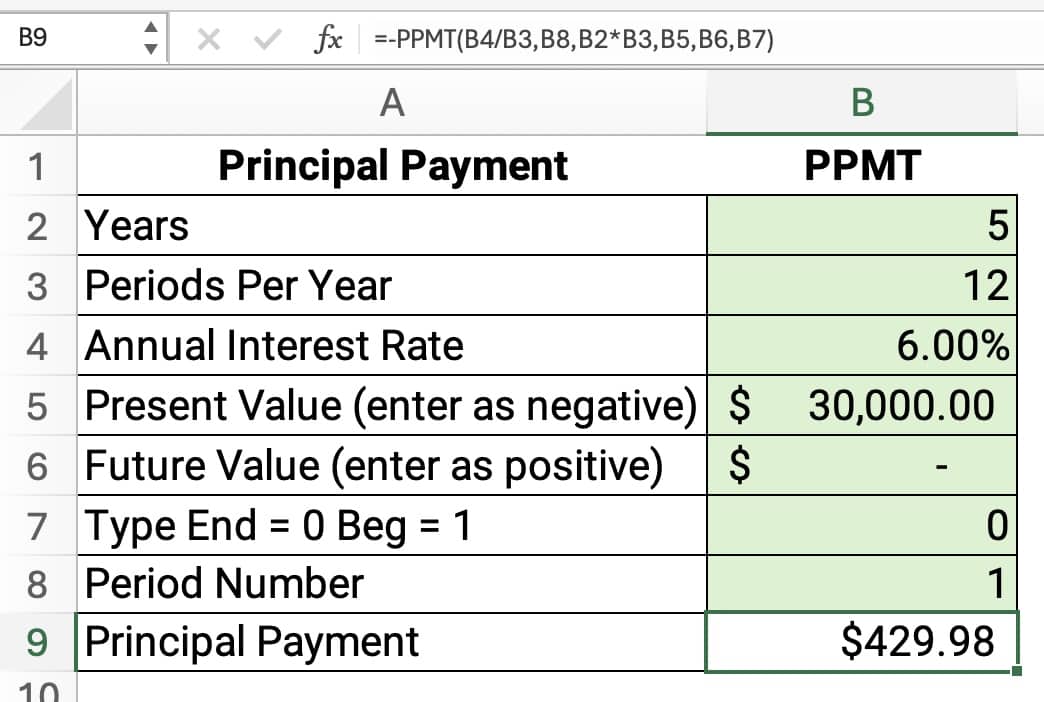
13 PPMT financial function
The PPMT function calculates the amount of a principal payment. A payment on a loan is composed of both principal and interest.
The PMT function calculates the total payment. The PPMT function calculates the principal only. A related function, the IPMT function, calculates the interest portion.
PPMT function syntax
The PPMT function syntax is:
= PPMT (rate, per, nper, pv, fv, type)
▪ Rate: is the interest rate per period. For example, use 6%/12 for monthly payments
▪ Per: specifies the period and must be in the range 1 to nper.
▪ Nper: is the total number of payment periods in an investment.
▪ Pv: is the present value: the total amount that a series of future payments is worth now.
▪ Fv: is the future value, or cash balance, you want to attain after the last payment is made.
▪ Type: payment at the beginning of the period = 1; payment at the end of the period = 0 or omitted.
PPMT function example
Cassidy had a 5 year car loan of $30,000 with an interest rate of 6%. What is the first month’s principal payment?
The principal portion of the payment for the first month is $429.98.
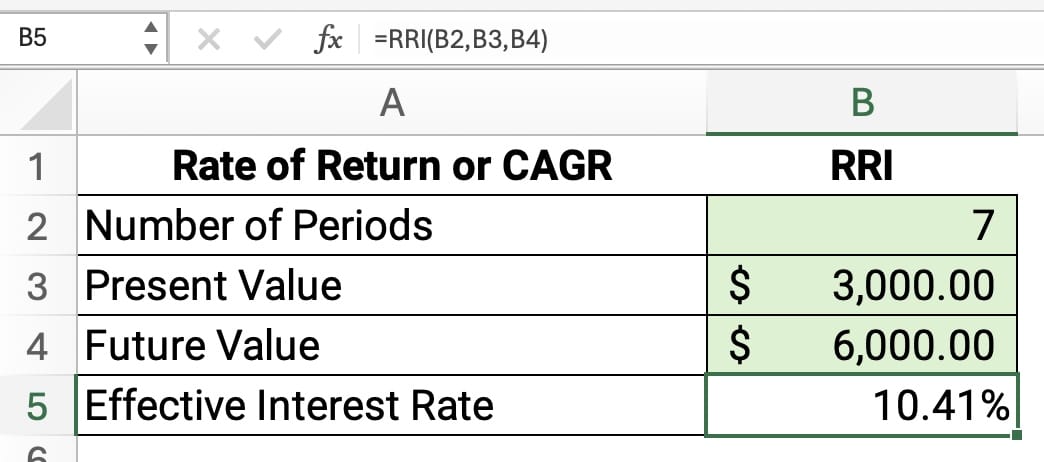
14 RRI financial function
The RRI function calculates the rate of return on an investment. This annualized return is also called the compounded annual growth rate (CAGR).
RRI function syntax
The syntax for the RRI function is:
= RRI(nper, pv, fv)
▪ Nper: number of periods for the investment
▪ Pv: present value of the investment
▪ Fv: future value of the investment
RRI function example
Zane has an investment with a balance of $6,000. The initial investment was 7 years ago of $3,000. What is the compound annual growth rate?
The CAGR is 10.41%.
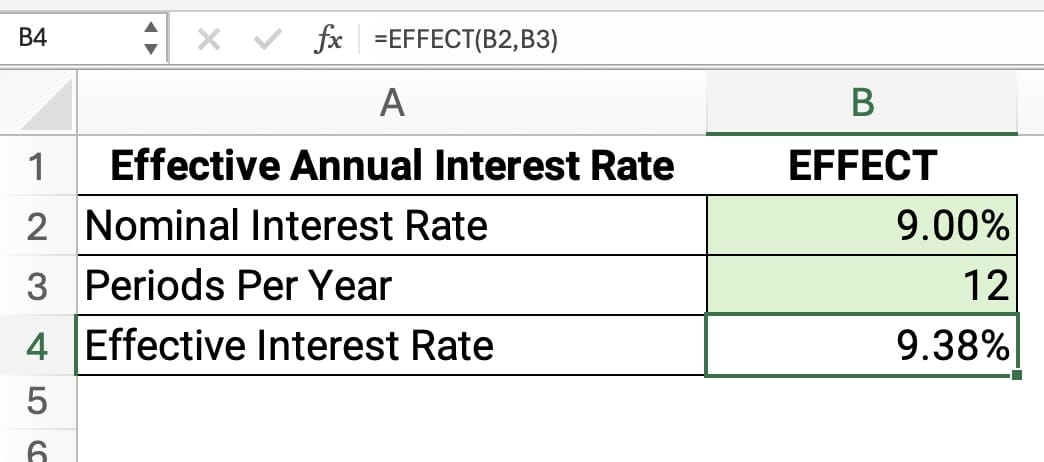
15 EFFECT financial function
The EFFECT function calculates the effective annual interest rate of a loan or an investment.
EFFECT function syntax
The syntax of the EFFECT function is:
= EFFECT(nominal_rate, npery).
- nominal_rate: stated annual interest rate as a percentage
- npery: number of compounding periods in a year; 1 = annually, 2 = semiannually, 4 = quarterly, or 12 = monthly
EFFECT function example
What is the effective annual rate (EAR) of a 9% loan compounded monthly?
The effective annual rate is 9.38%.
Top 15 Financial Functions Tutorial
Financial functions resources
For more Excel financial functions, see the following resources:
- Finally Learn: Financial Functions in Excel
- Microsoft: Financial Functions List
- Rice University: Excel Financial Functions
- Journal of Accountancy: Factoring in the time value of money with Excel