You can now get stock prices quickly using stock data types in Excel. This article explains how to pull stock prices using Excel.
Stock data types is a new feature in Excel using Microsoft 365. Recently, Microsoft released brand new data types for Excel 365. The first were the stocks and geography data types. This article explains the stocks data types. Before data types, there were only three types of data in Excel:
- Text
- Numbers
- Formulas
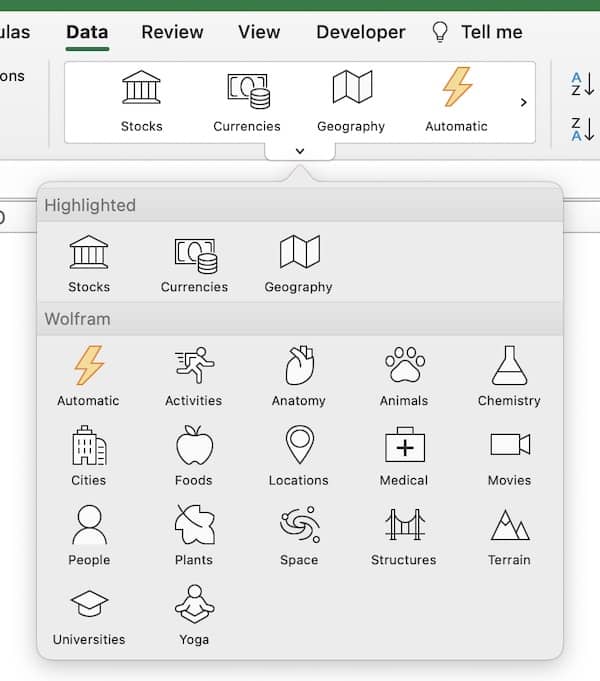
Microsoft added another category of data called data types. These data types are in Excel 365 only. The data types are on the data ribbon. The are many available data types in Excel:
- stocks
- currencies
- geography
- activities
- anatomy
- animals
- chemistry
- cities
- foods
- locations
- medical
- movies
- people
- plants
- space
- structures
- terrain
- universities
- yoga
Contents
Stock prices in Excel
Here is how the stock data type works. You can enter a company name or ticker symbol and Excel converts them to stock data types. Here is what I have tried that works so far:
- Company name – they don’t have to be the official name or capitalized: Apple, disney, Coca cola, google all work
- Company ticker symbol – AAPL, KO, WMT, and DIS retrieves Apple, Coca-Cola, Walmart, and Walt Disney
- Mutual fund ticker symbol – FXAIX, VFIAX, and SWPPX finds Fidelity S&P 500, Vanguard S&P 500, and Schwab S&P 500 index funds
- Currency pairs – CADUSD or USDEUR pulls the Canadian Dollar / US Dollar exchange rate or the US Dollar / Euro exchange rate.
The data types are located on the Data tab and there are two buttons. One is Stocks and the other is Geography. Notice the special symbols Excel uses for stocks and geography. Stocks symbol looks like a financial institution and the geography symbol is a map.

Company name or ticker
When you enter the company names or ticker symbols, highlight your list. Then go to the Data tab and select the Stocks button. Excel will recognize the list as companies and convert the text to the stocks data type. You will now see the stocks symbol like the image below.
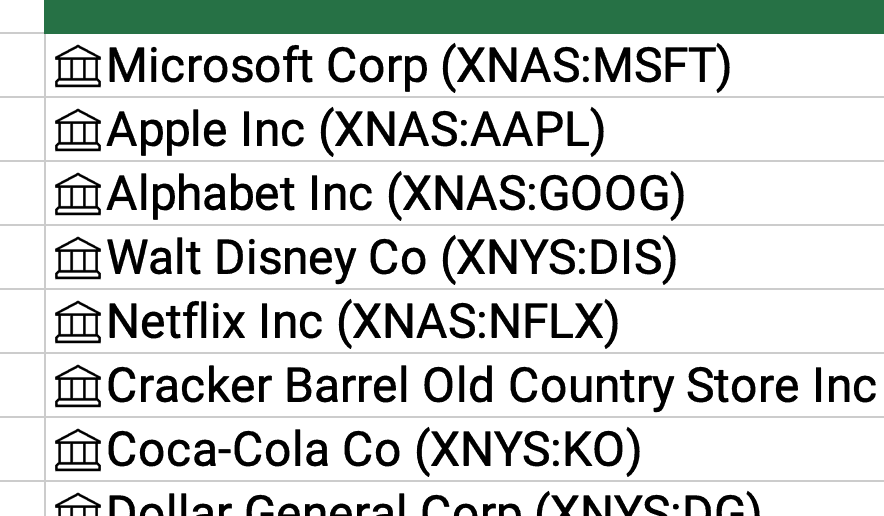
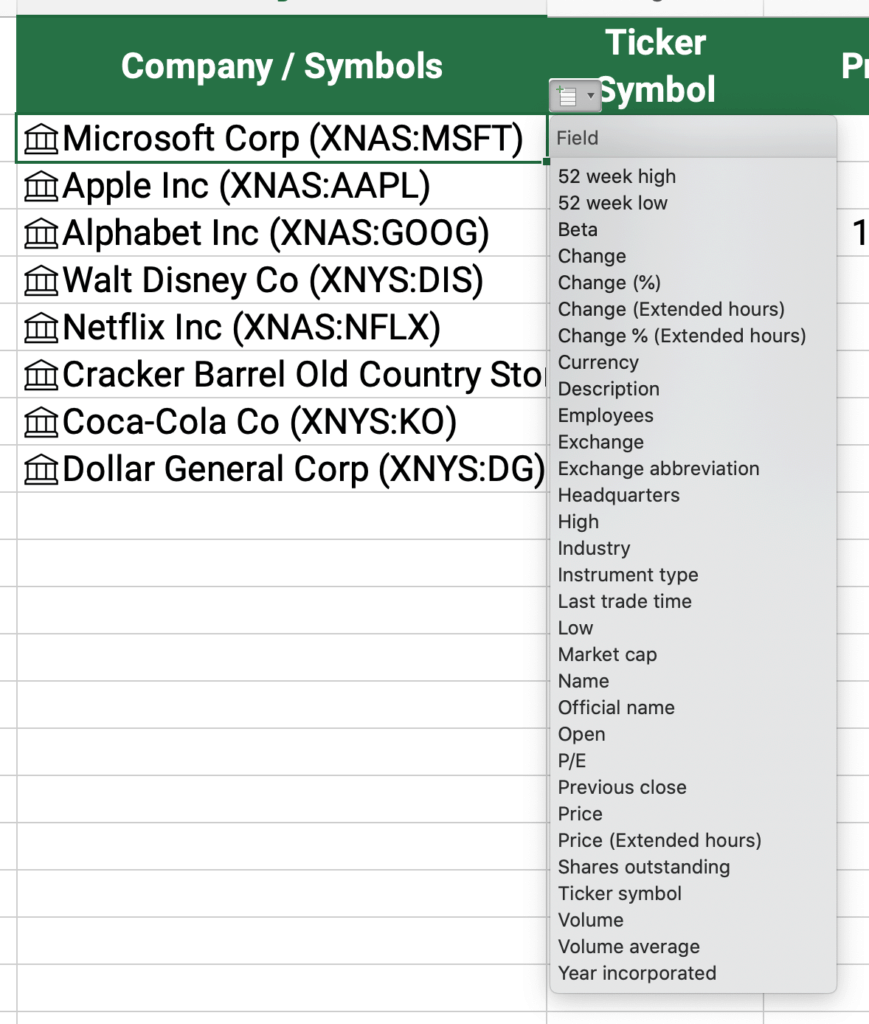
Once the list is changed to stock data type, there will be a dropdown list of all the available options for Excel to pull. These include the stock price, industry, ticker symbol, and currency.
See the image below for all the options for corporate stocks. There are over 30 data points that Excel can retrieve for a company.
Mutual fund prices
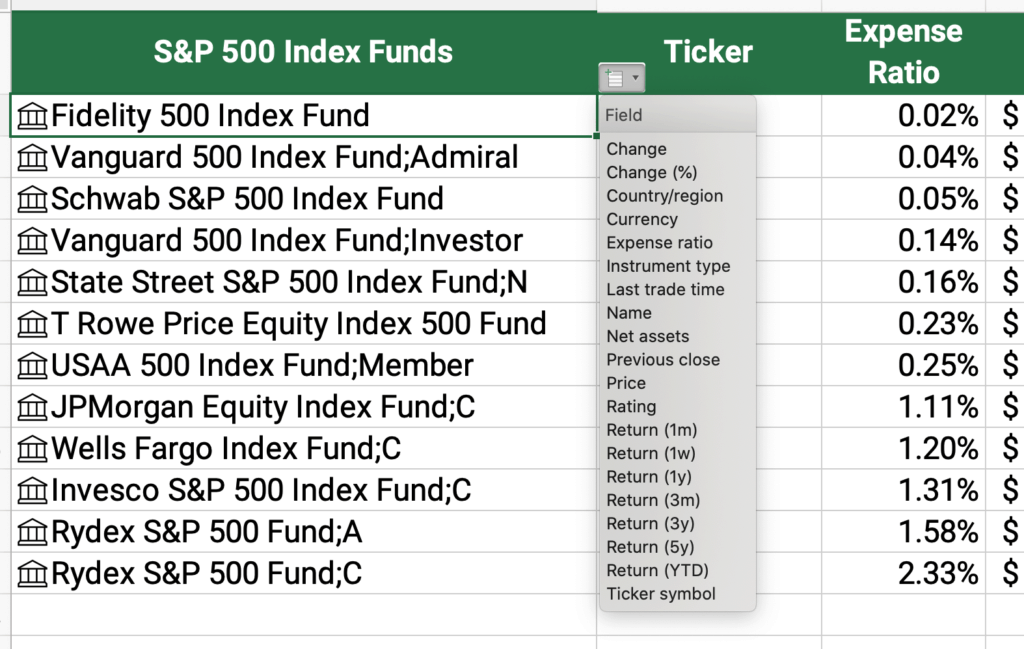
Excel can also retrieve information about mutual funds or ETFs. You need to know the ticker for the mutual fund. Once the mutual fund tickers are converted to stocks data type, the dropdown has different options for mutual funds.
Since the selected cell is a mutual fund, Excel can retrieve returns for different time periods up to 5 years. It also can find the recent price and the expense ratio. This is very helpful! See the image below for all 20 data options.
Forex currency pairs
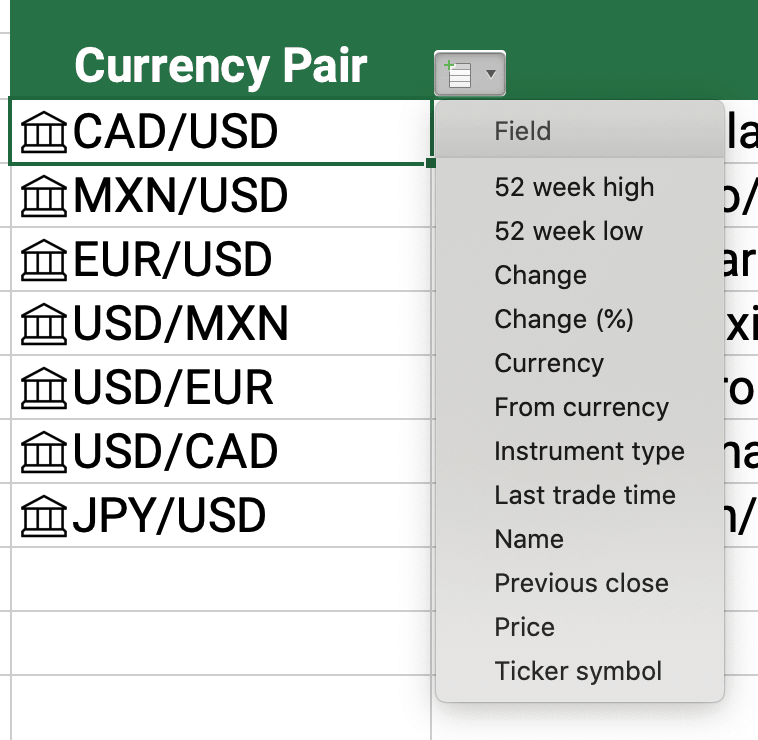
Finally, Excel can find the foreign exchange (FOREX) for a currency pair. So, CADUSD returns the Canadian dollar to U.S. dollar exchange rate. USDMXN retrieves the U.S. dollar to Mexican peso exchange rate.
If a currency pair ticker symbol is selected, there are 12 options for Excel to retrieve. See the image below.
Excel stock prices tutorial
If you want to see a video tutorial on how to use the stocks function, see the video below. I created it to show all the options below.
Now you try it…
Have you tried to use the Excel stocks data types? What have you used it for? Let me know if you try it and how it works for you. Leave a comment or question below.
If you want to learn more Excel:
Top 5 Places to Learn Excel for Free
Ultimate Guide to Learn Excel Basics


